
Page 50 - Dust Explosions in the Process Industries
P. 50
Dust Explosions:An Overview 23
differences in the distribution of the number of explosion accidents on the various dust
categories. This may reflect both a change with time, from the first to the second part of
this century, and differences between the structure of the industry in the United States and
the Federal Republic of Germany. One example is food and feed, which only represented
25% of all the explosionsin the Federal Republic of Germany, whereas in the United States
the percentage was more than 50. However, the percentages of both fatalities and injuries
for this dust group both in the Federal Republic of Germany and the United States was
higher than the percentage of explosions. On the other hand, the percentage of the explo-
sions involving metal dusts was about twice as high in the Federal Republic of Germany
as in the United States. The higher percentage of both fatalities and injuries for metal
dust explosions than the percentage of the number of explosions is, however, in agree-
ment with the older data from the United States. This probably reflects the extreme vio-
lence and temperatures of flames of metals like magnesium, aluminum, and silicon.
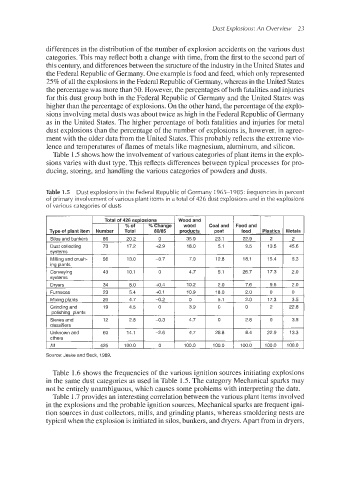
Table 1.5shows how the involvement of various categories of plant items in the explo-
sions varies with dust type. This reflects differences between typical processes for pro-
ducing, storing, and handling the various categories of powders and dusts.
Table 1.5 Dust explosions in the Federal Republic of Germany 1965-1 985: frequencies in percent
of primary involvement of various plant items in a total of 426 dust explosions and in the explosions
of various categories of dusts
Plastics Metals
2 2
13.5 45.6
5.1 qq
Mixing plants 20 4.7 +0.2 0 2.0
Grinding and 19 4.5 0 3.9 0 0 22.8
polishing plants 0 1 3.5 I
Sieves and 12 2.8 -0.3 4.7 0 2.8
classifiers
Unknown and 60 14.1 -2.6 4.7 28.8 8.4
others
All 426 100.0 0 100.0 100.0 100.0 4100.0 100.0
Table 1.6 shows the frequencies of the various ignition sources initiating explosions
in the same dust categories as used in Table 1.5. The category Mechanical sparks may
not be entirely unambiguous, which causes some problems with interpreting the data.
Table 1.7provides an interesting correlation between the various plant items involved
in the explosions and the probable ignition sources. Mechanical sparks are frequent igni-
tion sources in dust collectors, mills, and grinding plants, whereas smoldering nests are
typical when the explosion is initiated in silos, bunkers, and dryers. Apart from in dryers,