
Page 252 - Dynamic Loading and Design of Structures
P. 252
Page 223
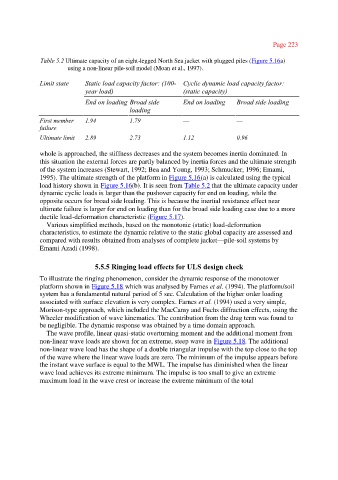
Table 5.2 Ultimate capacity of an eight-legged North Sea jacket with plugged piles (Figure 5.16a)
using a non-linear pile-soil model (Moan et al., 1997).
Limit state Static load capacity factor: (100- Cyclic dynamic load capacity factor:
year load) (static capacity)
End on loading Broad side End on loading Broad side loading
loading
First member 1.94 1.79 — —
failure
Ultimate limit 2.89 2.73 1.12 0.96
whole is approached, the stiffness decreases and the system becomes inertia dominated. In
this situation the external forces are partly balanced by inertia forces and the ultimate strength
of the system increases (Stewart, 1992; Bea and Young, 1993; Schmucker, 1996; Emami,
1995). The ultimate strength of the platform in Figure 5.16(a) is calculated using the typical
load history shown in Figure 5.16(b). It is seen from Table 5.2 that the ultimate capacity under
dynamic cyclic loads is larger than the pushover capacity for end on loading, while the
opposite occurs for broad side loading. This is because the inertial resistance effect near
ultimate failure is larger for end on loading than for the broad side loading case due to a more
ductile load-deformation characteristic (Figure 5.17).
Various simplified methods, based on the monotonie (static) load-deformation
characteristics, to estimate the dynamic relative to the static global capacity are assessed and
compared with results obtained from analyses of complete jacket—pile-soil systems by
Emami Azadi (1998).
5.5.5 Ringing load effects for ULS design check
To illustrate the ringing phenomenon, consider the dynamic response of the monotower
platform shown in Figure 5.18 which was analysed by Farnes et al. (1994). The platform/soil
system has a fundamental natural period of 5 sec. Calculation of the higher order loading
associated with surface elevation is very complex. Farnes et al. (1994) used a very simple,
Morison-type approach, which included the MacCamy and Fuchs diffraction effects, using the
Wheeler modification of wave kinematics. The contribution from the drag term was found to
be negligible. The dynamic response was obtained by a time domain approach.
The wave profile, linear quasi-static overturning moment and the additional moment from
non-linear wave loads are shown for an extreme, steep wave in Figure 5.18. The additional
non-linear wave load has the shape of a double triangular impulse with the top close to the top
of the wave where the linear wave loads are zero. The minimum of the impulse appears before
the instant wave surface is equal to the MWL. The impulse has diminished when the linear
wave load achieves its extreme minimum. The impulse is too small to give an extreme
maximum load in the wave crest or increase the extreme minimum of the total