
Page 26 - Dynamic Loading and Design of Structures
P. 26
Page 13
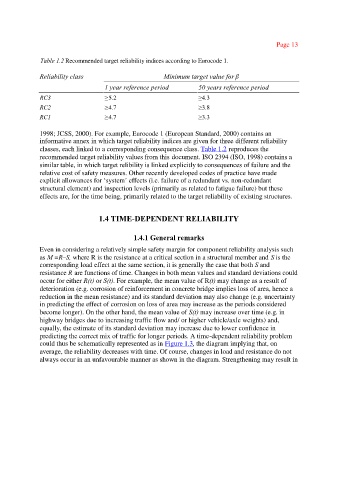
Table 1.2 Recommended target reliability indices according to Eurocode 1.
Reliability class Minimum target value for β
1 year reference period 50 years reference period
RC3 ≥5.2 ≥4.3
RC2 ≥4.7 ≥3.8
RC1 ≥4.7 ≥3.3
1998; JCSS, 2000). For example, Eurocode 1 (European Standard, 2000) contains an
informative annex in which target reliability indices are given for three different reliability
classes, each linked to a corresponding consequence class. Table 1.2 reproduces the
recommended target reliability values from this document. ISO 2394 (ISO, 1998) contains a
similar table, in which target relibility is linked explicitly to consequences of failure and the
relative cost of safety measures. Other recently developed codes of practice have made
explicit allowances for ‘system’ effects (i.e. failure of a redundant vs. non-redundant
structural element) and inspection levels (primarily as related to fatigue failure) but these
effects are, for the time being, primarily related to the target reliability of existing structures.
1.4 TIME-DEPENDENT RELIABILITY
1.4.1 General remarks
Even in considering a relatively simple safety margin for component reliability analysis such
as M =R–S, where R is the resistance at a critical section in a structural member and S is the
corresponding load effect at the same section, it is generally the case that both S and
resistance R are functions of time. Changes in both mean values and standard deviations could
occur for either R(t) or S(t). For example, the mean value of R(t) may change as a result of
deterioration (e.g. corrosion of reinforcement in concrete bridge implies loss of area, hence a
reduction in the mean resistance) and its standard deviation may also change (e.g. uncertainty
in predicting the effect of corrosion on loss of area may increase as the periods considered
become longer). On the other hand, the mean value of S(t) may increase over time (e.g. in
highway bridges due to increasing traffic flow and/ or higher vehicle/axle weights) and,
equally, the estimate of its standard deviation may increase due to lower confidence in
predicting the correct mix of traffic for longer periods. A time-dependent reliability problem
could thus be schematically represented as in Figure 1.3, the diagram implying that, on
average, the reliability decreases with time. Of course, changes in load and resistance do not
always occur in an unfavourable manner as shown in the diagram. Strengthening may result in