
Page 54 - Dynamic Loading and Design of Structures
P. 54
Page 37
Figure 2.6 DLF for load with duration time td.
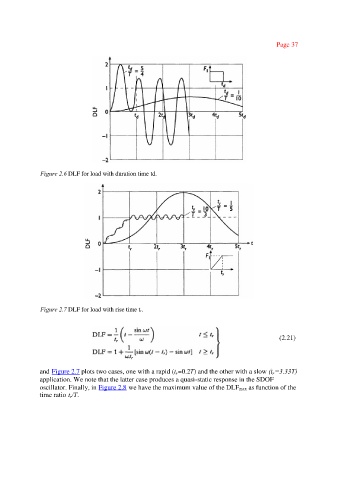
Figure 2.7 DLF for load with rise time tr.
(2.21)
and Figure 2.7 plots two cases, one with a rapid (t =0.2T) and the other with a slow (t =3.33T)
r
r
application. We note that the latter case produces a quasi-static response in the SDOF
oscillator. Finally, in Figure 2.8 we have the maximum value of the DLFmax as function of the
time ratio t /T.
r