
Page 201 - Dynamics and Control of Nuclear Reactors
P. 201
14.9 Reactor dynamics 199
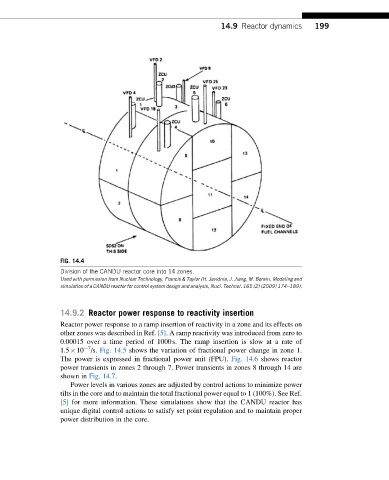
FIG. 14.4
Division of the CANDU reactor core into 14 zones.
Used with permission from Nuclear Technology, Francis & Taylor (H. Javidnia, J. Jiang, M. Borairi, Modeling and
simulation of a CANDU reactor for control system design and analysis, Nucl. Technol. 165 (2) (2009) 174–189).
14.9.2 Reactor power response to reactivity insertion
Reactor power response to a ramp insertion of reactivity in a zone and its effects on
other zones was described in Ref. [5]. A ramp reactivity was introduced from zero to
0.00015 over a time period of 1000s. The ramp insertion is slow at a rate of
7
1.5 10 /s. Fig. 14.5 shows the variation of fractional power change in zone 1.
The power is expressed in fractional power unit (FPU). Fig. 14.6 shows reactor
power transients in zones 2 through 7. Power transients in zones 8 through 14 are
shown in Fig. 14.7.
Power levels in various zones are adjusted by control actions to minimize power
tilts in the core and to maintain the total fractional power equal to 1 (100%). See Ref.
[5] for more information. These simulations show that the CANDU reactor has
unique digital control actions to satisfy set point regulation and to maintain proper
power distribution in the core.