
Page 86 - Dynamics and Control of Nuclear Reactors
P. 86
7.6 Combined reactivity feedback 79
Some fission products appear immediately upon a fission reaction (primary fis-
sion products) and some appear after decay of primary fission products (secondary
fission products). The short-term effect of a power change is a prompt change in pri-
mary fission product production, a delayed change in secondary fission product
production, and a prompt change in burnup of fission products present before the
power change. Therefore, differences occur in the path to equilibrium for different
fission products.
Xe-135, the most important fission product, undergoes an important trajectory to
equilibrium. Most of the Xe-135 comes from decay of I-135 and a smaller production
as a primary fission product. Consider the response to a power increase. The short-
term effect is an increase in Xe-135 burnout by neutron absorption. This is a positive
reactivity feedback. The increased flux also causes an increase in I-135 production.
As I-135 concentration increases, more Xe-135 appears due to decay of I-135. The
increase in Xe-135 is a negative reactivity feedback. The contribution to Xe-135
production by I-135 decay eventually results in a higher Xe-135 concentration than
existed before the power increase. Thus, the Xe-135 feedback reactivity coefficient is
positive immediately after a power change and becomes negative as time passes.
The positive portion lasts for a few hours and the negative portion reaches equilib-
rium in many hours. See Chapter 6 for details of Xe-135 poisoning and its influence
on neutron dynamics. Note that Xe-135 effects are much slower (hours) than
temperature and pressure effects (seconds).
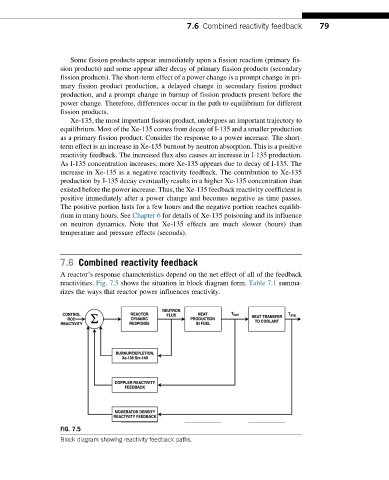
7.6 Combined reactivity feedback
A reactor’s response characteristics depend on the net effect of all of the feedback
reactivities. Fig. 7.5 shows the situation in block diagram form. Table 7.1 summa-
rizes the ways that reactor power influences reactivity.
FIG. 7.5
Block diagram showing reactivity feedback paths.