
Page 89 - Dynamics and Control of Nuclear Reactors
P. 89
82 CHAPTER 7 Reactivity feedbacks
At low frequencies, the magnitude of G is very large, and Eq. (7.4) may be approx-
imated as
δO 1
(7.5)
δI H
Note that G and H are functions of frequency, ω (rad/s).
So, the low frequency response is determined by the feedback reactivity. The
units of H are reactivity over power (typically, cents/% power). So, the units of
1/H are % power/cent of reactivity, or simply the inverse of the power coefficient.
At low frequencies, the feedback, H, “keeps up” with a reactivity perturbation.
That is, the magnitude is constant at low frequencies. As frequency increases, the feed-
back becomes unable to “keep up” with reactivity perturbations. That is, the magnitude
of H starts to decrease at some frequency. The frequency at which this change occurs is
characterized by the “break frequency”, typically the reciprocal of the fuel-to-coolant
heat transfer time constant in reactors with dominant fuel reactivity feedback. The
feedback has a decreasing effect on the overall response at higher frequencies.
Now consider frequencies much higher than the break frequency of H where the
magnitude of H is small and G dominates the transfer function. At high frequencies
the transfer function may be approximated by the forward transfer function, G. In
this case
δO
G (7.6)
δI
That is, the reactor responds as if it has no feedback.
The arguments presented above should be intuitive to the reader.
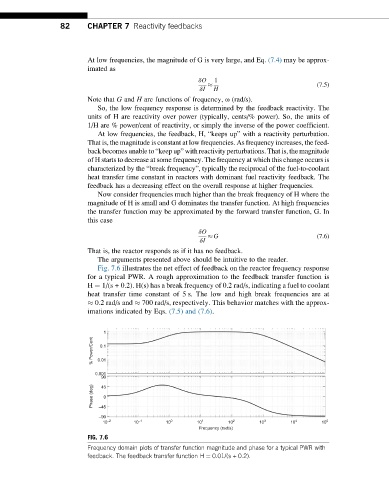
Fig. 7.6 illustrates the net effect of feedback on the reactor frequency response
for a typical PWR. A rough approximation to the feedback transfer function is
H ¼ 1/(s + 0.2). H(s) has a break frequency of 0.2 rad/s, indicating a fuel to coolant
heat transfer time constant of 5 s. The low and high break frequencies are at
0.2 rad/s and 700 rad/s, respectively. This behavior matches with the approx-
imations indicated by Eqs. (7.5) and (7.6).
1
% Power/Cent 0.01
0.1
0.001
90
Phase (deg) 45 0
–45
–90
10 –2 10 –1 10 0 10 1 10 2 10 3 10 4 10 5
Frequency (rad/s)
FIG. 7.6
Frequency domain plots of transfer function magnitude and phase for a typical PWR with
feedback. The feedback transfer function H ¼ 0.01/(s + 0.2).