
Page 117 - E-Bussiness and E-Commerce Management Strategy, Implementation, and Practice
P. 117
M02_CHAF9601_04_SE_C02.QXD:D01_CHAF7409_04_SE_C01.QXD 16/4/09 11:07 Page 84
84 Part 1 Introduction
Ad revenue option Measure Site
Pages served 100,000
CPM (Cost Per Thousand) £2
% Inventory served 40%
Avg. Clickthrough (CTR %) 0.10%
Display Ad units served per page 2
advertising (CPM) Clicks – CPM ads 80
Revenue – display ads £160
Earnings per 100 clicks (EPC) £200.0
eCPM – display ads £1.60
% Inventory served 100%
Avg. Clickthrough (CTR %) 0.30%
Fixed Ad units served 1 1
Run-of-site Clicks – fixed 300
Sponsorship Revenue – fixed sponsorship £3,000
Earnings per 100 clicks (EPC) £1,000.0
eCPM – fixed £30.00
% Inventory served 100%
Avg. Clickthrough (CTR %) 1.00%
Avg. Cost Per Click £0.30
Text ad Ad units served per page 1
advertising (CPC) Clicks – CPC ads 1,000
Revenue – CPC ads £300
Earnings per 100 clicks (EPC) £30.0
eCPM – CPC ads £3
% Inventory served 100%
Avg. Clickthrough (CTR %) 0.50%
Ad units served per page 1
Clicks – Affiliates 500
Affiliate Desination conversion rate (%) 3%
Commission Average order value £100
Commission % 10%
£150
Revenue – affiliates £30.0
Earnings per 100 clicks (EPC)
eCPM – affiliates £1.50
Clicks – total 1,880
Overall metrics Revenue – total £3,610
for site Earnings per 100 clicks (EPC) – total £192.02
eCPM – total £36.10
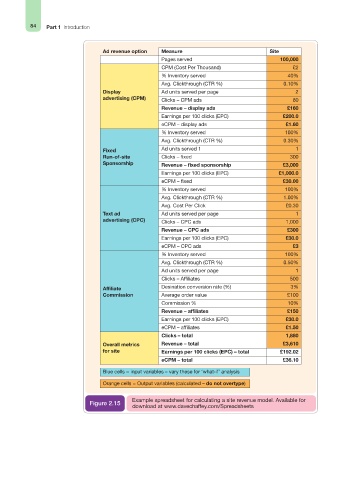
Blue cells = input variables – vary these for ‘what-if’ analysis
Orange cells = Output variables (calculated – do not overtype)
Example spreadsheet for calculating a site revenue model. Available for
Figure 2.15
download at www.davechaffey.com/Spreadsheets