
Page 150 - Earth's Climate Past and Future
P. 150
126 PART III • Orbital-Scale Climate Change
Time: T + 5,750 years
0
Perihelion 90˚
axis
T + T 0
0
ω March 20 11,500 180˚ 0˚
Equinox 360˚
years (=T +
0
23,000
years)
B 270˚
A T + 17,250 years
0
FIGURE 7-12 Precession and the angle ω (A) The angle between lines marking Earth’s
perihelion axis and the vernal equinox (March 20) is called ω. (B) The angle ω increases from 0°
to 360° with each full 23,000-year cycle of precession.
This complicated angular motion can be represented These gradual movements of precession bring
in a simplified mathematical form by using basic geome- the solstices and equinoxes (and all other times of the
try and trigonometry to convert the angular motions in year) into orbital positions that vary in distance from
Figure 7-12 to a rectangular coordinate system. Box 7–2 the Sun. Consider the two extreme positions of the
shows how the mathematical sine wave function projects solstices in the eccentric orbit (Figure 7-13). As noted
the motion of a radius vector sweeping around a circle earlier, in the present orbit, the position of the June 21
onto a vertical coordinate. This conversion allows the solstice (northern hemisphere summer and southern
circular motion to be represented as an oscillating sine hemisphere winter) occurs very near aphelion, the
wave on a simple x-y plot. The amplitude of sinω moves most distant pass from the Sun (Figure 7-13 top). This
from a value of +1 to –1 and back again over each greater Earth-Sun distance on June 21 slightly reduces
23,000-year precession cycle. the amount of solar radiation received during those
The second aspect of Earth’s orbital motion that seasons. Conversely, with the December 21 solstice
needs to be considered is its eccentricity. If Earth’s orbit (northern hemisphere winter and southern hemi-
were perfectly circular, the slow movements of the sol- sphere summer) currently occurring near perihelion,
stices and equinoxes caused by precession would not the closest pass to the Sun, solar radiation is higher at
alter the amount of sunlight received on Earth because those seasons than it would be in a perfectly circular
the distance to the Sun would remain constant through orbit. Approximately 11,000 years ago, half of a pre-
time. Because the orbit is not circular, however, move- cession cycle before now, this configuration was
ments of the solstices and equinoxes (see Figure 7-11) reversed (Figure 7-13 bottom). The June 21 solstice
cause long-term changes in the amount of solar radia- occurred at perihelion, and the December 21 solstice
tion received on Earth. occurred at aphelion.
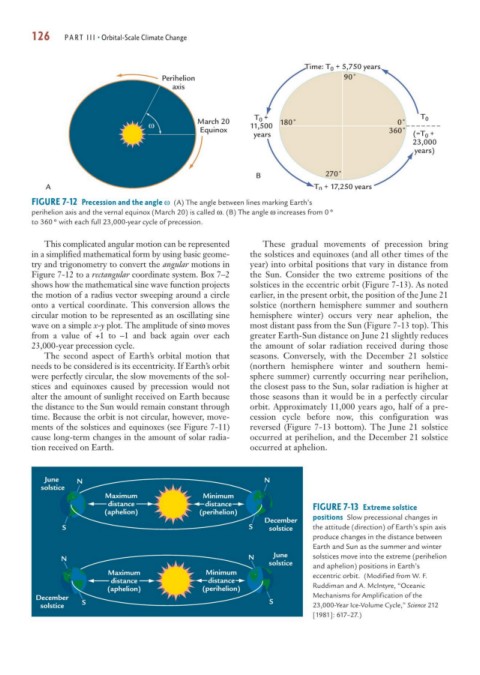
June N N
solstice
Maximum Minimum
distance distance
(aphelion) (perihelion) FIGURE 7-13 Extreme solstice
December positions Slow precessional changes in
S S solstice the attitude (direction) of Earth’s spin axis
produce changes in the distance between
Earth and Sun as the summer and winter
N N June solstices move into the extreme (perihelion
solstice
and aphelion) positions in Earth’s
Maximum Minimum eccentric orbit. (Modified from W. F.
distance distance
(aphelion) (perihelion) Ruddiman and A. McIntyre, “Oceanic
December S Mechanisms for Amplification of the
solstice S 23,000-Year Ice-Volume Cycle,” Science 212
[1981]: 617–27.)