
Page 154 - Earth's Climate Past and Future
P. 154
130 PART III • Orbital-Scale Climate Change
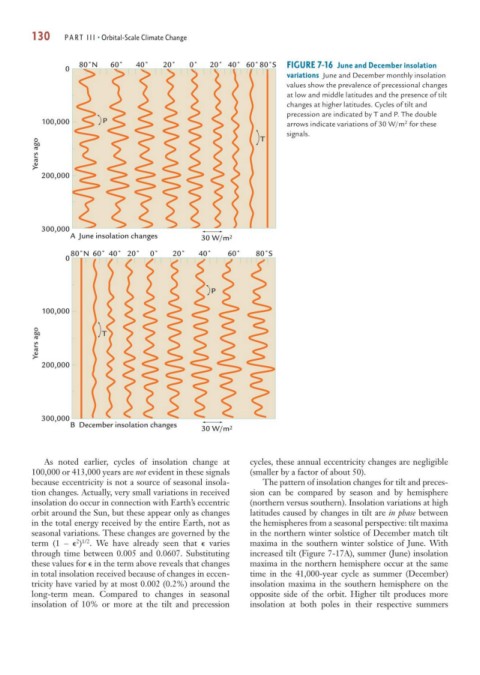
80˚N 60˚ 40˚ 20˚ 0˚ 20˚ 40˚ 60˚80˚S FIGURE 7-16 June and December insolation
0
variations June and December monthly insolation
values show the prevalence of precessional changes
at low and middle latitudes and the presence of tilt
changes at higher latitudes. Cycles of tilt and
precession are indicated by T and P. The double
100,000 P arrows indicate variations of 30 W/m for these
2
signals.
T
Years ago
200,000
300,000
A June insolation changes 30 W/m 2
80˚N 60˚ 40˚ 20˚ 0˚ 20˚ 40˚ 60˚ 80˚S
0
P
100,000
Years ago T
200,000
300,000
B December insolation changes
30 W/m 2
As noted earlier, cycles of insolation change at cycles, these annual eccentricity changes are negligible
100,000 or 413,000 years are not evident in these signals (smaller by a factor of about 50).
because eccentricity is not a source of seasonal insola- The pattern of insolation changes for tilt and preces-
tion changes. Actually, very small variations in received sion can be compared by season and by hemisphere
insolation do occur in connection with Earth’s eccentric (northern versus southern). Insolation variations at high
orbit around the Sun, but these appear only as changes latitudes caused by changes in tilt are in phase between
in the total energy received by the entire Earth, not as the hemispheres from a seasonal perspective: tilt maxima
seasonal variations. These changes are governed by the in the northern winter solstice of December match tilt
2 1/2
term (1 – ) . We have already seen that varies maxima in the southern winter solstice of June. With
through time between 0.005 and 0.0607. Substituting increased tilt (Figure 7-17A), summer (June) insolation
these values for in the term above reveals that changes maxima in the northern hemisphere occur at the same
in total insolation received because of changes in eccen- time in the 41,000-year cycle as summer (December)
tricity have varied by at most 0.002 (0.2%) around the insolation maxima in the southern hemisphere on the
long-term mean. Compared to changes in seasonal opposite side of the orbit. Higher tilt produces more
insolation of 10% or more at the tilt and precession insolation at both poles in their respective summers