
Page 156 - Earth's Climate Past and Future
P. 156
132 PART III • Orbital-Scale Climate Change
+ Winter Summer
1916 years 40° 60° 80° 40° 60° 80°
July 0
June August
Insolation anomaly 50,000
years
100,000 41,000
23,000 years
_ Years ago
Time
150,000
FIGURE 7-18 Family of monthly precession curves Because
all seasons change position (precess) around Earth’s orbit,
each season (and month) has its own insolation trend through
time. Monthly insolation curves are offset by slightly less than 23,000
2000 years (23,000 years divided by 12 months). 200,000 years
250,000
These changes in speed cause changes in the lengths
of the months and seasons in relation to a year deter- Departure from modern insolation
2
(cal/cm /day)
mined by “calendar time” (day of the year). The net 0
effect is that changes in the amplitude of insolation vari- > +20 < –20
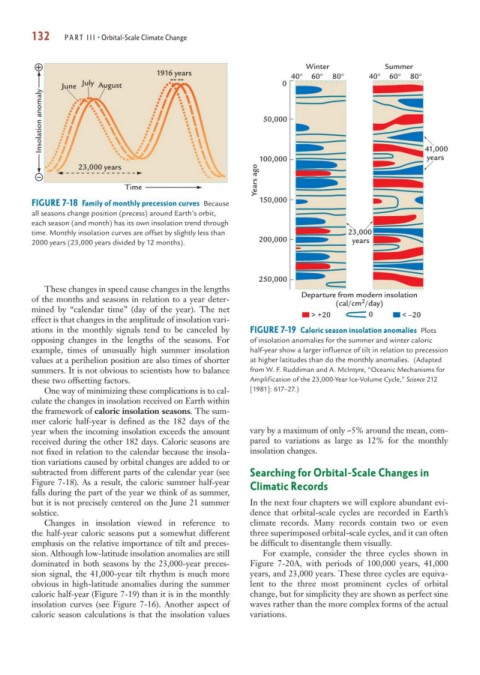
ations in the monthly signals tend to be canceled by FIGURE 7-19 Caloric season insolation anomalies Plots
opposing changes in the lengths of the seasons. For of insolation anomalies for the summer and winter caloric
example, times of unusually high summer insolation half-year show a larger influence of tilt in relation to precession
values at a perihelion position are also times of shorter at higher latitudes than do the monthly anomalies. (Adapted
summers. It is not obvious to scientists how to balance from W. F. Ruddiman and A. McIntyre, “Oceanic Mechanisms for
these two offsetting factors. Amplification of the 23,000-Year Ice-Volume Cycle,” Science 212
One way of minimizing these complications is to cal- [1981]: 617–27.)
culate the changes in insolation received on Earth within
the framework of caloric insolation seasons. The sum-
mer caloric half-year is defined as the 182 days of the
year when the incoming insolation exceeds the amount vary by a maximum of only ~5% around the mean, com-
received during the other 182 days. Caloric seasons are pared to variations as large as 12% for the monthly
not fixed in relation to the calendar because the insola- insolation changes.
tion variations caused by orbital changes are added to or
subtracted from different parts of the calendar year (see Searching for Orbital-Scale Changes in
Figure 7-18). As a result, the caloric summer half-year Climatic Records
falls during the part of the year we think of as summer,
but it is not precisely centered on the June 21 summer In the next four chapters we will explore abundant evi-
solstice. dence that orbital-scale cycles are recorded in Earth’s
Changes in insolation viewed in reference to climate records. Many records contain two or even
the half-year caloric seasons put a somewhat different three superimposed orbital-scale cycles, and it can often
emphasis on the relative importance of tilt and preces- be difficult to disentangle them visually.
sion. Although low-latitude insolation anomalies are still For example, consider the three cycles shown in
dominated in both seasons by the 23,000-year preces- Figure 7-20A, with periods of 100,000 years, 41,000
sion signal, the 41,000-year tilt rhythm is much more years, and 23,000 years. These three cycles are equiva-
obvious in high-latitude anomalies during the summer lent to the three most prominent cycles of orbital
caloric half-year (Figure 7-19) than it is in the monthly change, but for simplicity they are shown as perfect sine
insolation curves (see Figure 7-16). Another aspect of waves rather than the more complex forms of the actual
caloric season calculations is that the insolation values variations.