
Page 171 - Earth's Climate Past and Future
P. 171
CHAPTER 8 • Insolation Control of Monsoons 147
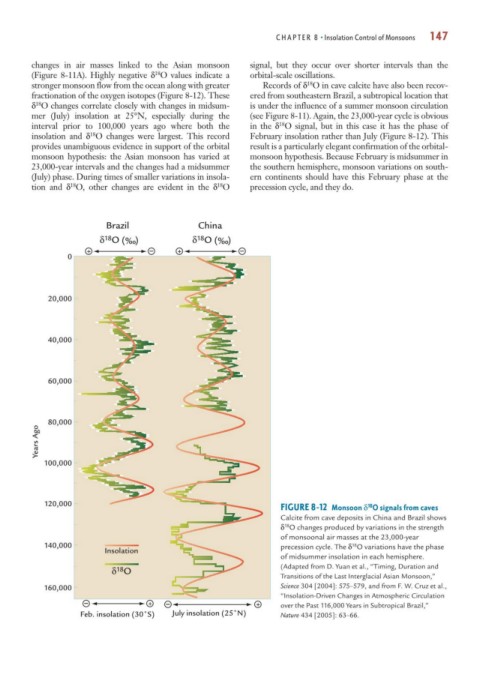
changes in air masses linked to the Asian monsoon signal, but they occur over shorter intervals than the
18
(Figure 8-11A). Highly negative δ O values indicate a orbital-scale oscillations.
18
stronger monsoon flow from the ocean along with greater Records of δ O in cave calcite have also been recov-
fractionation of the oxygen isotopes (Figure 8-12). These ered from southeastern Brazil, a subtropical location that
18
δ O changes correlate closely with changes in midsum- is under the influence of a summer monsoon circulation
mer (July) insolation at 25°N, especially during the (see Figure 8-11). Again, the 23,000-year cycle is obvious
interval prior to 100,000 years ago where both the in the δ O signal, but in this case it has the phase of
18
insolation and δ O changes were largest. This record February insolation rather than July (Figure 8-12). This
18
provides unambiguous evidence in support of the orbital result is a particularly elegant confirmation of the orbital-
monsoon hypothesis: the Asian monsoon has varied at monsoon hypothesis. Because February is midsummer in
23,000-year intervals and the changes had a midsummer the southern hemisphere, monsoon variations on south-
(July) phase. During times of smaller variations in insola- ern continents should have this February phase at the
18
tion and δ O, other changes are evident in the δ O precession cycle, and they do.
18
Brazil China
18
18
δ O ( ) δ O ( )
_ _
+ +
0
20,000
40,000
60,000
80,000
Years Ago
100,000
120,000
FIGURE 8-12 Monsoon δ O signals from caves
18
Calcite from cave deposits in China and Brazil shows
18
δ O changes produced by variations in the strength
of monsoonal air masses at the 23,000-year
140,000 precession cycle. The δ O variations have the phase
18
Insolation
of midsummer insolation in each hemisphere.
(Adapted from D. Yuan et al., “Timing, Duration and
18
δ O
Transitions of the Last Interglacial Asian Monsoon,”
160,000 Science 304 [2004]: 575–579, and from F. W. Cruz et al.,
“Insolation-Driven Changes in Atmospheric Circulation
_ _
+ + over the Past 116,000 Years in Subtropical Brazil,”
Feb. insolation (30˚S) July insolation (25˚N) Nature 434 [2005]: 63–66.