
Page 183 - Earth's Climate Past and Future
P. 183
CHAPTER 9 • Insolation Control of Ice Sheets 159
accumulation and net ice ablation to shift back and
North South
forth across the land. Strong summer insolation warms
the high-latitude landmasses in summer, moves the cli-
4 mate point northward over the Arctic Ocean, and puts
+0.5 m/yr 3 northern landmasses in an ablation regime which melts
Positive mass balance 2 Altitude (km) all winter snow each summer and does not allow ice to
Negative mass balance
accumulate (see Figure 9–6 top). Weak summer insola-
tion allows the landmasses to cool, shifts the climate
Equilibrium –1 m/yr point southward over the land, and sets up a positive
mass balance over the northern edge of the continents
Climate point line –2 m/yr 1 so that permanent ice can accumulate (see Figure 9–6
–3 m/yr bottom).
0
Arctic Once ice sheets begin to form, their vertical dimen-
Ocean Northern edge sion (altitude) comes into play in a powerful way (Figure
of continent
9–7). As the ice sheets thicken, their upper surfaces
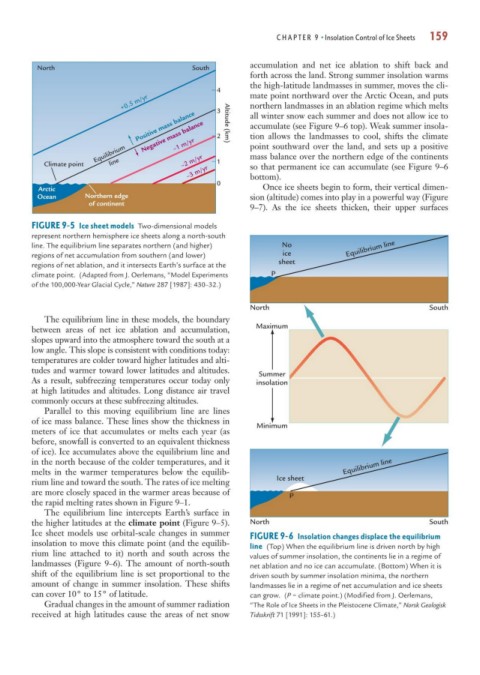
FIGURE 9-5 Ice sheet models Two-dimensional models
represent northern hemisphere ice sheets along a north-south
line. The equilibrium line separates northern (and higher) No Equilibrium line
regions of net accumulation from southern (and lower) ice
sheet
regions of net ablation, and it intersects Earth’s surface at the
climate point. (Adapted from J. Oerlemans, “Model Experiments P
of the 100,000-Year Glacial Cycle,” Nature 287 [1987]: 430–32.)
North South
The equilibrium line in these models, the boundary
Maximum
between areas of net ice ablation and accumulation,
slopes upward into the atmosphere toward the south at a
low angle. This slope is consistent with conditions today:
temperatures are colder toward higher latitudes and alti-
tudes and warmer toward lower latitudes and altitudes.
Summer
As a result, subfreezing temperatures occur today only insolation
at high latitudes and altitudes. Long distance air travel
commonly occurs at these subfreezing altitudes.
Parallel to this moving equilibrium line are lines
of ice mass balance. These lines show the thickness in
Minimum
meters of ice that accumulates or melts each year (as
before, snowfall is converted to an equivalent thickness
of ice). Ice accumulates above the equilibrium line and
in the north because of the colder temperatures, and it Equilibrium line
melts in the warmer temperatures below the equilib-
Ice sheet
rium line and toward the south. The rates of ice melting
are more closely spaced in the warmer areas because of
P
the rapid melting rates shown in Figure 9–1.
The equilibrium line intercepts Earth’s surface in
the higher latitudes at the climate point (Figure 9–5). North South
Ice sheet models use orbital-scale changes in summer
FIGURE 9-6 Insolation changes displace the equilibrium
insolation to move this climate point (and the equilib-
line (Top) When the equilibrium line is driven north by high
rium line attached to it) north and south across the values of summer insolation, the continents lie in a regime of
landmasses (Figure 9–6). The amount of north-south net ablation and no ice can accumulate. (Bottom) When it is
shift of the equilibrium line is set proportional to the driven south by summer insolation minima, the northern
amount of change in summer insolation. These shifts landmasses lie in a regime of net accumulation and ice sheets
can cover 10° to 15° of latitude. can grow. (P = climate point.) (Modified from J. Oerlemans,
Gradual changes in the amount of summer radiation “The Role of Ice Sheets in the Pleistocene Climate,” Norsk Geologisk
received at high latitudes cause the areas of net snow Tidsskrift 71 [1991]: 155–61.)