
Page 188 - Earth's Climate Past and Future
P. 188
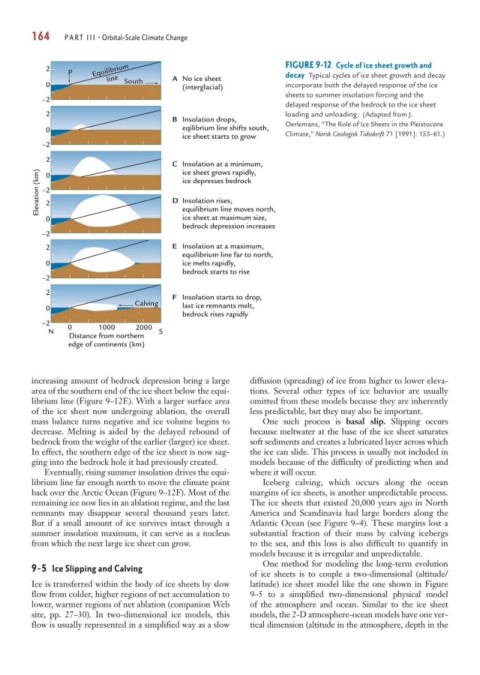
164     PART III • Orbital-Scale Climate Change


            2          Equilibrium                                  FIGURE 9-12 Cycle of ice sheet growth and
                 P
                          line            A  No ice sheet           decay Typical cycles of ice sheet growth and decay
            0                 South         (interglacial)          incorporate both the delayed response of the ice
                                                                    sheets to summer insolation forcing and the
           –2
                                                                    delayed response of the bedrock to the ice sheet
            2                                                       loading and unloading. (Adapted from J.
                                          B  Insolation drops,      Oerlemans, “The Role of Ice Sheets in the Pleistocene
            0                               eqilibrium line shifts south,
                                            ice sheet starts to grow  Climate,” Norsk Geologisk Tidsskrift 71 [1991]: 155–61.)
           –2
            2
                                          C  Insolation at a minimum,
                                            ice sheet grows rapidly,
          Elevation (km)  –2              D  ice depresses bedrock
            0
                                            Insolation rises,
            2
                                            ice sheet at maximum size,
            0                               equilibrium line moves north,
                                            bedrock depression increases
           –2
            2                             E  Insolation at a maximum,
                                            equilibrium line far to north,
            0                               ice melts rapidly,
                                            bedrock starts to rise
           –2
            2
                                          F  Insolation starts to drop,
                                 Calving
            0                               last ice remnants melt,
                                            bedrock rises rapidly
           –2    0      1000     2000
            N                         S
                 Distance from northern
                 edge of continents (km)


        increasing amount of bedrock depression bring a large  diffusion (spreading) of ice from higher to lower eleva-
        area of the southern end of the ice sheet below the equi-  tions. Several other types of ice behavior are usually
        librium line (Figure 9–12E). With a larger surface area  omitted from these models because they are inherently
        of the ice sheet now undergoing ablation, the overall  less predictable, but they may also be important.
        mass balance turns negative and ice volume begins to   One such process is  basal slip. Slipping occurs
        decrease. Melting is aided by the delayed rebound of  because meltwater at the base of the ice sheet saturates
        bedrock from the weight of the earlier (larger) ice sheet.  soft sediments and creates a lubricated layer across which
        In effect, the southern edge of the ice sheet is now sag-  the ice can slide. This process is usually not included in
        ging into the bedrock hole it had previously created.  models because of the difficulty of predicting when and
           Eventually, rising summer insolation drives the equi-  where it will occur.
        librium line far enough north to move the climate point  Iceberg calving, which occurs along the ocean
        back over the Arctic Ocean (Figure 9–12F). Most of the  margins of ice sheets, is another unpredictable process.
        remaining ice now lies in an ablation regime, and the last  The ice sheets that existed 20,000 years ago in North
        remnants may disappear several thousand years later.  America and Scandinavia had large borders along the
        But if a small amount of ice survives intact through a  Atlantic Ocean (see Figure 9–4). These margins lost a
        summer insolation maximum, it can serve as a nucleus  substantial fraction of their mass by calving icebergs
        from which the next large ice sheet can grow.       to the sea, and this loss is also difficult to quantify in
                                                            models because it is irregular and unpredictable.
                                                               One method for modeling the long-term evolution
        9-5 Ice Slipping and Calving
                                                            of ice sheets is to couple a two-dimensional (altitude/
        Ice is transferred within the body of ice sheets by slow  latitude) ice sheet model like the one shown in Figure
        flow from colder, higher regions of net accumulation to  9–5 to a simplified two-dimensional physical model
        lower, warmer regions of net ablation (companion Web  of the atmosphere and ocean. Similar to the ice sheet
        site, pp. 27–30). In two-dimensional ice models, this  models, the 2-D atmosphere-ocean models have one ver-
        flow is usually represented in a simplified way as a slow  tical dimension (altitude in the atmosphere, depth in the