
Page 193 - Earth's Climate Past and Future
P. 193
CHAPTER 9 • Insolation Control of Ice Sheets 169
FIGURE 9-17 Uplifted coral reef
terraces Terraces formed by
erosion-resistant coral reefs lie well
above sea level on the island of
New Guinea in the western Pacific.
(Courtesy of Arthur Bloom, Cornell
University.)
These longer-term tectonic and shorter-term orbital around a constant long-term mean value for millions of
controls on ice sheets are combined here in an initial years, their basic character has stayed nearly the same,
interpretation of the history of northern hemisphere and the same curve is repeated throughout this analysis.
glaciation (Figure 9–18). The first component of this The second component of the model is the assump-
conceptual model is a signal representative of changes tion of a threshold temperature below which ice sheets
in summer insolation at high northern latitudes. This can form. This threshold is represented as an equilib-
curve incorporates the combined influence of the cycles rium line that separates temperatures cold enough to
at 23,000 years (precession) and at 41,000 years (tilt). permit net ice accumulation (glaciation) from those
Because insolation changes at these cycles have varied warm enough to cause net melting of snow and ice. The
position of this threshold relative to the insolation curve
changes very slowly through time as the gradual cooling
of the last several million years proceeds.
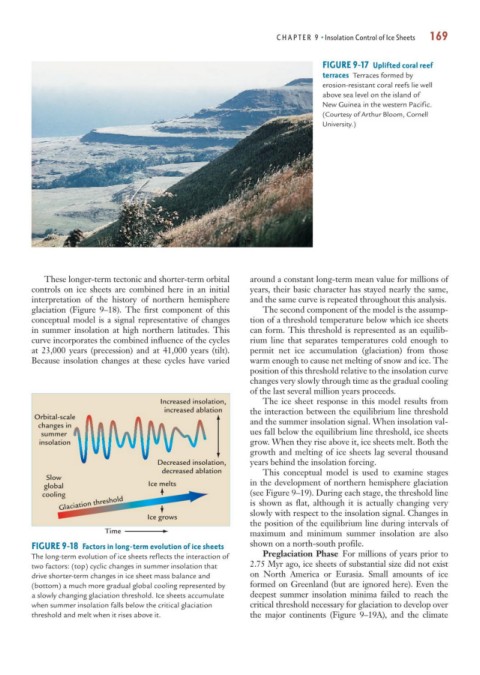
Increased insolation, The ice sheet response in this model results from
increased ablation the interaction between the equilibrium line threshold
Orbital-scale and the summer insolation signal. When insolation val-
changes in
summer ues fall below the equilibrium line threshold, ice sheets
insolation grow. When they rise above it, ice sheets melt. Both the
growth and melting of ice sheets lag several thousand
Decreased insolation, years behind the insolation forcing.
decreased ablation This conceptual model is used to examine stages
Slow
global Ice melts in the development of northern hemisphere glaciation
cooling (see Figure 9–19). During each stage, the threshold line
Glaciation threshold is shown as flat, although it is actually changing very
Ice grows slowly with respect to the insolation signal. Changes in
the position of the equilibrium line during intervals of
Time maximum and minimum summer insolation are also
FIGURE 9-18 Factors in long-term evolution of ice sheets shown on a north-south profile.
The long-term evolution of ice sheets reflects the interaction of Preglaciation Phase For millions of years prior to
two factors: (top) cyclic changes in summer insolation that 2.75 Myr ago, ice sheets of substantial size did not exist
drive shorter-term changes in ice sheet mass balance and on North America or Eurasia. Small amounts of ice
(bottom) a much more gradual global cooling represented by formed on Greenland (but are ignored here). Even the
a slowly changing glaciation threshold. Ice sheets accumulate deepest summer insolation minima failed to reach the
when summer insolation falls below the critical glaciation critical threshold necessary for glaciation to develop over
threshold and melt when it rises above it. the major continents (Figure 9–19A), and the climate