
Page 197 - Earth's Climate Past and Future
P. 197
CHAPTER 9 • Insolation Control of Ice Sheets 173
If the global cooling trend of the last 55 Myr were to
Summer insolation (65°N)
persist for tens of millions of years more, it is possible
Tilt Precession that the northern hemisphere would enter a different
23,000 phase in which the equilibrium line remains permanently
on the continents and ice sheets never melt. During the
41,000
Power last 500,000 years, we have avoided this state only during
relatively brief 10,000-year interglaciations that repre-
sent 10% of the entire time span. We have moved very
0 close to a state in which ice sheets are present perma-
Ice volume (2.75–0.9 Myr ago) nently on the northern continents. Antarctica has been in
a state of permanent glaciation for many millions of
41,000
years, Greenland for at least the last million years.
Power IN SUMMARY, the Milankovitch theory is a useful
23,000
starting point for understanding the history of
0 northern hemisphere glaciation. It explains the
Ice volume (0.9–0 Myr ago) presence of ice volume responses at 41,000 and 23,000
~ 100,000 years and the reason they lag several thousand years
behind the summer insolation forcing. But it fails to
explain the dominance of the 41,000-year cycle for
41,000 almost 2 Myr and the emergence of large oscillations
Power near 100,000 years within the last million years.
Something more complicated must be happening to
23,000 make ice sheets grow and melt at these rhythms. We
will return to this problem in Chapter 11.
0
Long Short
Orbital period (years)
Key Terms
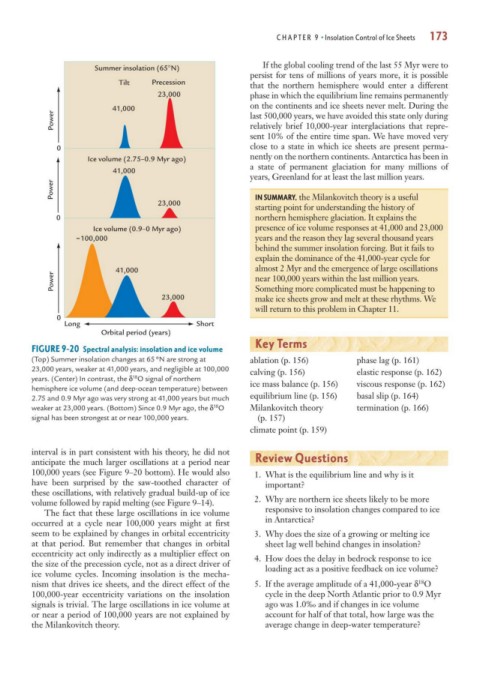
FIGURE 9-20 Spectral analysis: insolation and ice volume
(Top) Summer insolation changes at 65°N are strong at ablation (p. 156) phase lag (p. 161)
23,000 years, weaker at 41,000 years, and negligible at 100,000 calving (p. 156) elastic response (p. 162)
18
years. (Center) In contrast, the δ O signal of northern
hemisphere ice volume (and deep-ocean temperature) between ice mass balance (p. 156) viscous response (p. 162)
2.75 and 0.9 Myr ago was very strong at 41,000 years but much equilibrium line (p. 156) basal slip (p. 164)
18
weaker at 23,000 years. (Bottom) Since 0.9 Myr ago, the δ O Milankovitch theory termination (p. 166)
signal has been strongest at or near 100,000 years. (p. 157)
climate point (p. 159)
interval is in part consistent with his theory, he did not
anticipate the much larger oscillations at a period near Review Questions
100,000 years (see Figure 9–20 bottom). He would also 1. What is the equilibrium line and why is it
have been surprised by the saw-toothed character of important?
these oscillations, with relatively gradual build-up of ice
volume followed by rapid melting (see Figure 9–14). 2. Why are northern ice sheets likely to be more
The fact that these large oscillations in ice volume responsive to insolation changes compared to ice
occurred at a cycle near 100,000 years might at first in Antarctica?
seem to be explained by changes in orbital eccentricity 3. Why does the size of a growing or melting ice
at that period. But remember that changes in orbital sheet lag well behind changes in insolation?
eccentricity act only indirectly as a multiplier effect on 4. How does the delay in bedrock response to ice
the size of the precession cycle, not as a direct driver of loading act as a positive feedback on ice volume?
ice volume cycles. Incoming insolation is the mecha-
18
nism that drives ice sheets, and the direct effect of the 5. If the average amplitude of a 41,000-year δ O
100,000-year eccentricity variations on the insolation cycle in the deep North Atlantic prior to 0.9 Myr
signals is trivial. The large oscillations in ice volume at ago was 1.0‰ and if changes in ice volume
or near a period of 100,000 years are not explained by account for half of that total, how large was the
the Milankovitch theory. average change in deep-water temperature?