
Page 201 - Earth's Climate Past and Future
P. 201
CHAPTER 10 • Orbital-Scale Changes in Carbon Dioxide and Methane 177
annual layers can be detected thousands of years into the through the ice crystals. At a depth of about 50 m below
past. In contrast, on the moisture-starved central domes the surface, air can no longer circulate at all and is
of the Antarctic ice sheet, where ice accumulates at less trapped in place as small bubbles, a process called sin-
than 5 cm per year (the length of a finger), annual layer- tering. These air bubbles form a permanent record of
ing is barely detectable even in the surface snow and not the past atmosphere.
apparent in the stretched and thinned ice below. At the time the air bubbles are trapped, their slow
For cores without annual layering, one common diffusion beneath the surface makes their average age
technique for dating the ice is to construct an ice flow greater than that of the overlying atmosphere and the
model based on the physical properties of the ice sheet snow falling on the ice sheet. But the age of the bubbles
and the assumption of a smooth steady flow of ice below is younger than that of the ice in which they are trapped
the surface, like that shown in Figure 10–1. These mod- because the surrounding ice was deposited many years
els produce fairly good estimates of the age of the ice, earlier. The difference in age between the air bubbles
but they are not as accurate as annual layer counts. and the surrounding ice depends on the rate at which
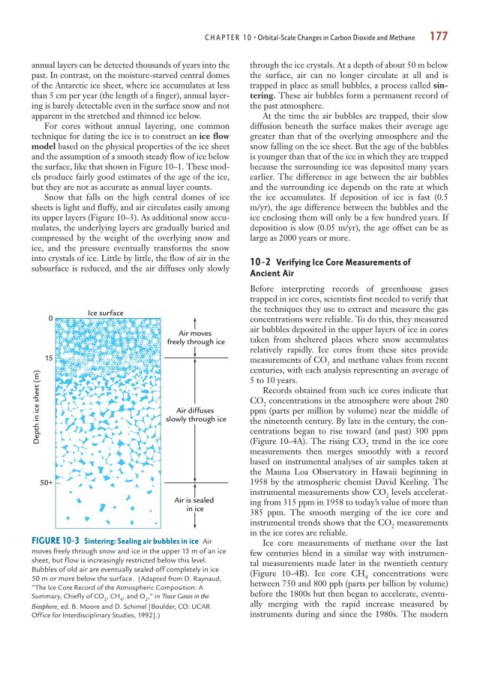
Snow that falls on the high central domes of ice the ice accumulates. If deposition of ice is fast (0.5
sheets is light and fluffy, and air circulates easily among m/yr), the age difference between the bubbles and the
its upper layers (Figure 10–3). As additional snow accu- ice enclosing them will only be a few hundred years. If
mulates, the underlying layers are gradually buried and deposition is slow (0.05 m/yr), the age offset can be as
compressed by the weight of the overlying snow and large as 2000 years or more.
ice, and the pressure eventually transforms the snow
into crystals of ice. Little by little, the flow of air in the 10-2 Verifying Ice Core Measurements of
subsurface is reduced, and the air diffuses only slowly
Ancient Air
Before interpreting records of greenhouse gases
trapped in ice cores, scientists first needed to verify that
the techniques they use to extract and measure the gas
Ice surface
0 concentrations were reliable. To do this, they measured
air bubbles deposited in the upper layers of ice in cores
Air moves
freely through ice taken from sheltered places where snow accumulates
relatively rapidly. Ice cores from these sites provide
15 measurements of CO and methane values from recent
2
centuries, with each analysis representing an average of
Depth in ice sheet (m) slowly through ice CO concentrations in the atmosphere were about 280
5 to 10 years.
Records obtained from such ice cores indicate that
2
ppm (parts per million by volume) near the middle of
Air diffuses
the nineteenth century. By late in the century, the con-
centrations began to rise toward (and past) 300 ppm
(Figure 10–4A). The rising CO trend in the ice core
2
measurements then merges smoothly with a record
based on instrumental analyses of air samples taken at
the Mauna Loa Observatory in Hawaii beginning in
50+ 1958 by the atmospheric chemist David Keeling. The
instrumental measurements show CO levels accelerat-
2
Air is sealed ing from 315 ppm in 1958 to today’s value of more than
in ice
385 ppm. The smooth merging of the ice core and
instrumental trends shows that the CO measurements
2
in the ice cores are reliable.
FIGURE 10-3 Sintering: Sealing air bubbles in ice Air Ice core measurements of methane over the last
moves freely through snow and ice in the upper 15 m of an ice few centuries blend in a similar way with instrumen-
sheet, but flow is increasingly restricted below this level. tal measurements made later in the twentieth century
Bubbles of old air are eventually sealed off completely in ice (Figure 10–4B). Ice core CH concentrations were
4
50 m or more below the surface. (Adapted from D. Raynaud, between 750 and 800 ppb (parts per billion by volume)
“The Ice Core Record of the Atmospheric Composition: A
Summary, Chiefly of CO , CH , and O ,” in Trace Gases in the before the 1800s but then began to accelerate, eventu-
2 4 2
Biosphere, ed. B. Moore and D. Schimel [Boulder, CO: UCAR ally merging with the rapid increase measured by
Office for Interdisciplinary Studies, 1992].) instruments during and since the 1980s. The modern