
Page 210 - Earth's Climate Past and Future
P. 210
186 PART III • Orbital-Scale Climate Change
13
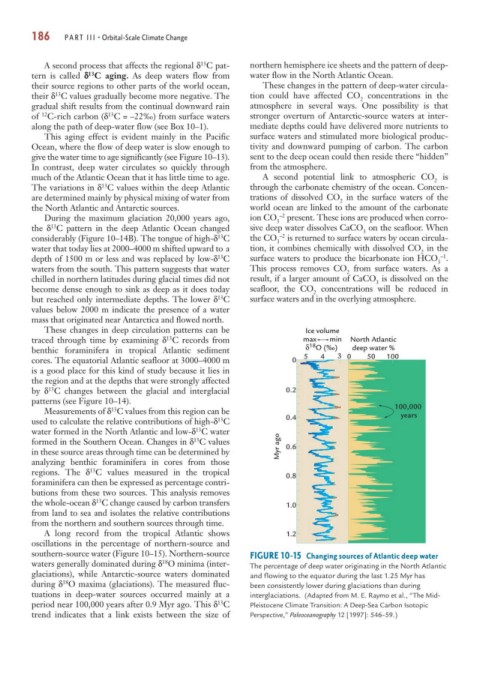
A second process that affects the regional δ C pat- northern hemisphere ice sheets and the pattern of deep-
13
tern is called δ C aging. As deep waters flow from water flow in the North Atlantic Ocean.
their source regions to other parts of the world ocean, These changes in the pattern of deep-water circula-
13
their δ C values gradually become more negative. The tion could have affected CO concentrations in the
2
gradual shift results from the continual downward rain atmosphere in several ways. One possibility is that
12
13
of C-rich carbon (δ C = –22‰) from surface waters stronger overturn of Antarctic-source waters at inter-
along the path of deep-water flow (see Box 10–1). mediate depths could have delivered more nutrients to
This aging effect is evident mainly in the Pacific surface waters and stimulated more biological produc-
Ocean, where the flow of deep water is slow enough to tivity and downward pumping of carbon. The carbon
give the water time to age significantly (see Figure 10–13). sent to the deep ocean could then reside there “hidden”
In contrast, deep water circulates so quickly through from the atmosphere.
much of the Atlantic Ocean that it has little time to age. A second potential link to atmospheric CO is
2
13
The variations in δ C values within the deep Atlantic through the carbonate chemistry of the ocean. Concen-
are determined mainly by physical mixing of water from trations of dissolved CO in the surface waters of the
2
the North Atlantic and Antarctic sources. world ocean are linked to the amount of the carbonate
During the maximum glaciation 20,000 years ago, ion CO 3 –2 present. These ions are produced when corro-
13
the δ C pattern in the deep Atlantic Ocean changed sive deep water dissolves CaCO on the seafloor. When
3
13
considerably (Figure 10–14B). The tongue of high-δ C the CO 3 –2 is returned to surface waters by ocean circula-
water that today lies at 2000–4000 m shifted upward to a tion, it combines chemically with dissolved CO in the
2
13
–1
depth of 1500 m or less and was replaced by low-δ C surface waters to produce the bicarbonate ion HCO .
3
waters from the south. This pattern suggests that water This process removes CO from surface waters. As a
2
chilled in northern latitudes during glacial times did not result, if a larger amount of CaCO is dissolved on the
3
become dense enough to sink as deep as it does today seafloor, the CO concentrations will be reduced in
2
13
but reached only intermediate depths. The lower δ C surface waters and in the overlying atmosphere.
values below 2000 m indicate the presence of a water
mass that originated near Antarctica and flowed north.
These changes in deep circulation patterns can be Ice volume
13
traced through time by examining δ C records from max min North Atlantic
18
benthic foraminifera in tropical Atlantic sediment δ O (‰) deep water %
cores. The equatorial Atlantic seafloor at 3000–4000 m 0 5 4 3 0 50 100
is a good place for this kind of study because it lies in
the region and at the depths that were strongly affected
13
by δ C changes between the glacial and interglacial 0.2
patterns (see Figure 10–14).
13
Measurements of δ C values from this region can be 100,000
years
13
used to calculate the relative contributions of high-δ C 0.4
13
water formed in the North Atlantic and low-δ C water
13
formed in the Southern Ocean. Changes in δ C values Myr ago 0.6
in these source areas through time can be determined by
analyzing benthic foraminifera in cores from those
13
regions. The δ C values measured in the tropical 0.8
foraminifera can then be expressed as percentage contri-
butions from these two sources. This analysis removes
13
the whole-ocean δ C change caused by carbon transfers 1.0
from land to sea and isolates the relative contributions
from the northern and southern sources through time.
A long record from the tropical Atlantic shows 1.2
oscillations in the percentage of northern-source and
southern-source water (Figure 10–15). Northern-source FIGURE 10-15 Changing sources of Atlantic deep water
18
waters generally dominated during δ O minima (inter- The percentage of deep water originating in the North Atlantic
glaciations), while Antarctic-source waters dominated and flowing to the equator during the last 1.25 Myr has
18
during δ O maxima (glaciations). The measured fluc- been consistently lower during glaciations than during
tuations in deep-water sources occurred mainly at a interglaciations. (Adapted from M. E. Raymo et al., “The Mid-
13
period near 100,000 years after 0.9 Myr ago. This δ C Pleistocene Climate Transition: A Deep-Sea Carbon Isotopic
trend indicates that a link exists between the size of Perspective,” Paleoceanography 12 [1997]: 546–59.)