
Page 211 - Earth's Climate Past and Future
P. 211
CHAPTER 10 • Orbital-Scale Changes in Carbon Dioxide and Methane 187
On a global average basis, this mechanism acts slowly where decaying plant matter uses up the available oxy-
(over thousands of years) because of the time required to gen and creates the necessary reducing conditions.
dissolve deep-sea carbonates and because of the slow Most natural wetlands are located in the tropics and in
overturn of the deep ocean. Deep-ocean regions experi- boreal (circum-Arctic) regions.
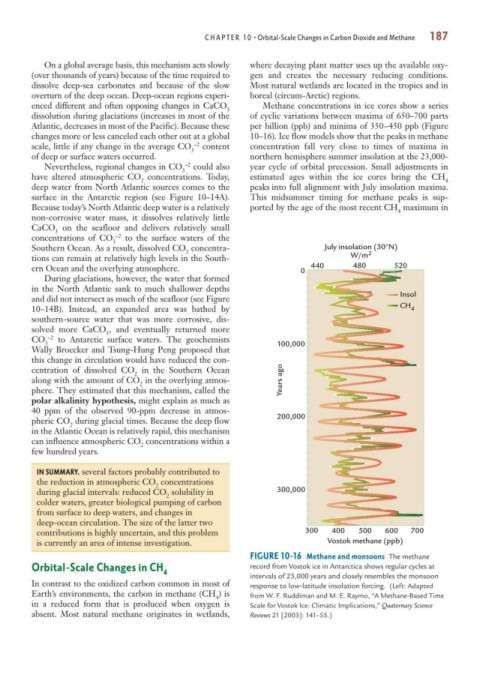
enced different and often opposing changes in CaCO Methane concentrations in ice cores show a series
3
dissolution during glaciations (increases in most of the of cyclic variations between maxima of 650–700 parts
Atlantic, decreases in most of the Pacific). Because these per billion (ppb) and minima of 350–450 ppb (Figure
changes more or less canceled each other out at a global 10–16). Ice flow models show that the peaks in methane
scale, little if any change in the average CO –2 content concentration fall very close to times of maxima in
3
of deep or surface waters occurred. northern hemisphere summer insolation at the 23,000-
Nevertheless, regional changes in CO –2 could also year cycle of orbital precession. Small adjustments in
3
have altered atmospheric CO concentrations. Today, estimated ages within the ice cores bring the CH
2 4
deep water from North Atlantic sources comes to the peaks into full alignment with July insolation maxima.
surface in the Antarctic region (see Figure 10–14A). This midsummer timing for methane peaks is sup-
Because today’s North Atlantic deep water is a relatively ported by the age of the most recent CH maximum in
4
non-corrosive water mass, it dissolves relatively little
CaCO on the seafloor and delivers relatively small
3
concentrations of CO –2 to the surface waters of the
3
Southern Ocean. As a result, dissolved CO concentra- July insolation (30°N)
2 2
tions can remain at relatively high levels in the South- W/m
ern Ocean and the overlying atmosphere. 0 440 480 520
During glaciations, however, the water that formed
in the North Atlantic sank to much shallower depths
and did not intersect as much of the seafloor (see Figure Insol
10–14B). Instead, an expanded area was bathed by CH 4
southern-source water that was more corrosive, dis-
solved more CaCO , and eventually returned more
3
CO –2 to Antarctic surface waters. The geochemists
3 100,000
Wally Broecker and Tsung-Hung Peng proposed that
this change in circulation would have reduced the con-
centration of dissolved CO in the Southern Ocean
2
along with the amount of CO in the overlying atmos- Years ago
2
phere. They estimated that this mechanism, called the
polar alkalinity hypothesis, might explain as much as
40 ppm of the observed 90-ppm decrease in atmos-
pheric CO during glacial times. Because the deep flow 200,000
2
in the Atlantic Ocean is relatively rapid, this mechanism
can influence atmospheric CO concentrations within a
2
few hundred years.
IN SUMMARY, several factors probably contributed to
the reduction in atmospheric CO concentrations
2
during glacial intervals: reduced CO solubility in 300,000
2
colder waters, greater biological pumping of carbon
from surface to deep waters, and changes in
deep-ocean circulation. The size of the latter two
contributions is highly uncertain, and this problem 300 400 500 600 700
is currently an area of intense investigation. Vostok methane (ppb)
FIGURE 10-16 Methane and monsoons The methane
Orbital-Scale Changes in CH record from Vostok ice in Antarctica shows regular cycles at
4
intervals of 23,000 years and closely resembles the monsoon
In contrast to the oxidized carbon common in most of response to low-latitude insolation forcing. (Left: Adapted
Earth’s environments, the carbon in methane (CH ) is
4 from W. F. Ruddiman and M. E. Raymo, “A Methane-Based Time
in a reduced form that is produced when oxygen is Scale for Vostok Ice: Climatic Implications,” Quaternary Science
absent. Most natural methane originates in wetlands, Reviews 21 [2003]: 141–55.)