
Page 216 - Earth's Climate Past and Future
P. 216
192 PART III • Orbital-Scale Climate Change
Summer insolation (65°N) characteristics. One factor is their height: they protrude
thousands of meters into the air and form massive
Tilt Precession obstacles to the free circulation of winds in the lower
23,000 atmosphere, thereby rearranging the flow of air. In
41,000 addition, their bright surfaces reflect much more
Power incoming sunlight than do darker ice-free surfaces.
This loss of solar heating in regions covered by ice cools
the air above the ice sheets and in nearby areas.
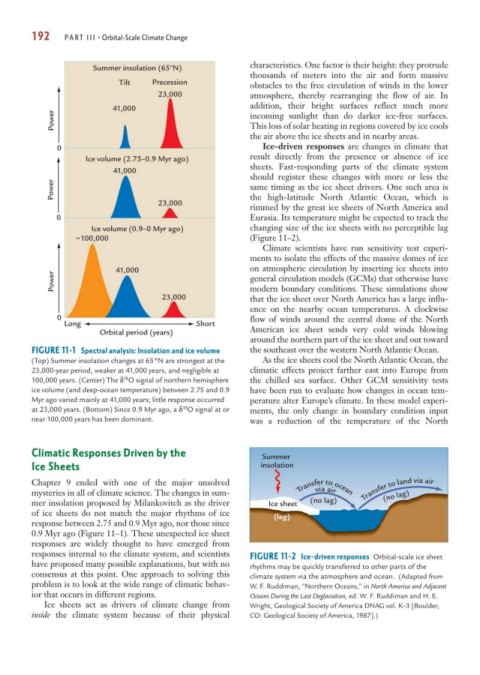
0 Ice-driven responses are changes in climate that
Ice volume (2.75–0.9 Myr ago) result directly from the presence or absence of ice
sheets. Fast-responding parts of the climate system
41,000
should register these changes with more or less the
Power same timing as the ice sheet drivers. One such area is
the high-latitude North Atlantic Ocean, which is
23,000
rimmed by the great ice sheets of North America and
0 Eurasia. Its temperature might be expected to track the
Ice volume (0.9–0 Myr ago) changing size of the ice sheets with no perceptible lag
~ 100,000 (Figure 11–2).
Climate scientists have run sensitivity test experi-
ments to isolate the effects of the massive domes of ice
41,000 on atmospheric circulation by inserting ice sheets into
Power general circulation models (GCMs) that otherwise have
modern boundary conditions. These simulations show
23,000 that the ice sheet over North America has a large influ-
ence on the nearby ocean temperatures. A clockwise
0 flow of winds around the central dome of the North
Long Short
Orbital period (years) American ice sheet sends very cold winds blowing
around the northern part of the ice sheet and out toward
FIGURE 11-1 Spectral analysis: Insolation and ice volume the southeast over the western North Atlantic Ocean.
(Top) Summer insolation changes at 65°N are strongest at the As the ice sheets cool the North Atlantic Ocean, the
23,000-year period, weaker at 41,000 years, and negligible at climatic effects project farther east into Europe from
18
100,000 years. (Center) The δ O signal of northern hemisphere the chilled sea surface. Other GCM sensitivity tests
ice volume (and deep-ocean temperature) between 2.75 and 0.9 have been run to evaluate how changes in ocean tem-
Myr ago varied mainly at 41,000 years; little response occurred perature alter Europe’s climate. In these model experi-
18
at 23,000 years. (Bottom) Since 0.9 Myr ago, a δ O signal at or ments, the only change in boundary condition input
near 100,000 years has been dominant. was a reduction of the temperature of the North
Climatic Responses Driven by the Summer
Ice Sheets insolation
Chapter 9 ended with one of the major unsolved
via air
mysteries in all of climate science. The changes in sum- Transfer to ocean Transfer to land via air
(no lag)
mer insolation proposed by Milankovitch as the driver Ice sheet (no lag)
of ice sheets do not match the major rhythms of ice (lag)
response between 2.75 and 0.9 Myr ago, nor those since
0.9 Myr ago (Figure 11–1). These unexpected ice sheet
responses are widely thought to have emerged from
responses internal to the climate system, and scientists FIGURE 11-2 Ice-driven responses Orbital-scale ice sheet
have proposed many possible explanations, but with no rhythms may be quickly transferred to other parts of the
consensus at this point. One approach to solving this climate system via the atmosphere and ocean. (Adapted from
problem is to look at the wide range of climatic behav- W. F. Ruddiman, “Northern Oceans,” in North America and Adjacent
ior that occurs in different regions. Oceans During the Last Deglaciation, ed. W. F. Ruddiman and H. E.
Ice sheets act as drivers of climate change from Wright, Geological Society of America DNAG vol. K–3 [Boulder,
inside the climate system because of their physical CO: Geological Society of America, 1987].)