
Page 221 - Earth's Climate Past and Future
P. 221
CHAPTER 11 • Orbital-Scale Interactions, Feedbacks, and Unsolved Problems 197
Sea-surface Ice volume Europe FIGURE 11-9 North Atlantic
temperature (°C) Max Min % tree pollen sea-surface temperature and European
5 10 15 0 50 100 18
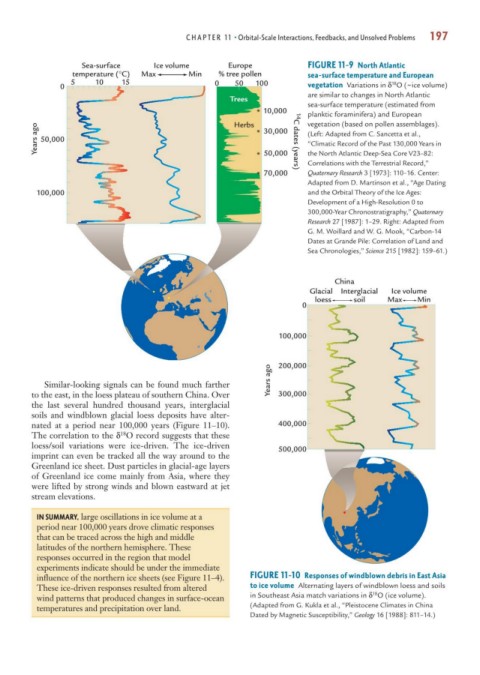
0 vegetation Variations in δ O ( ice volume)
~
are similar to changes in North Atlantic
Trees
sea-surface temperature (estimated from
* 10,000 planktic foraminifera) and European
vegetation (based on pollen assemblages).
Years ago 50,000 Herbs * 30,000 14 C dates (years) (Left: Adapted from C. Sancetta et al.,
“Climatic Record of the Past 130,000 Years in
the North Atlantic Deep-Sea Core V23–82:
* 50,000
Correlations with the Terrestrial Record,”
* 70,000 Quaternary Research 3 [1973]: 110–16. Center:
Adapted from D. Martinson et al., “Age Dating
100,000 and the Orbital Theory of the Ice Ages:
Development of a High-Resolution 0 to
300,000-Year Chronostratigraphy,” Quaternary
Research 27 [1987]: 1–29. Right: Adapted from
G. M. Woillard and W. G. Mook, “Carbon-14
Dates at Grande Pile: Correlation of Land and
Sea Chronologies,” Science 215 [1982]: 159–61.)
China
Glacial Interglacial Ice volume
loess soil Max Min
0
100,000
Years ago 200,000
Similar-looking signals can be found much farther
to the east, in the loess plateau of southern China. Over 300,000
the last several hundred thousand years, interglacial
soils and windblown glacial loess deposits have alter-
nated at a period near 100,000 years (Figure 11–10). 400,000
18
The correlation to the δ O record suggests that these
loess/soil variations were ice-driven. The ice-driven
500,000
imprint can even be tracked all the way around to the
Greenland ice sheet. Dust particles in glacial-age layers
of Greenland ice come mainly from Asia, where they
were lifted by strong winds and blown eastward at jet
stream elevations.
IN SUMMARY, large oscillations in ice volume at a
period near 100,000 years drove climatic responses
that can be traced across the high and middle
latitudes of the northern hemisphere. These
responses occurred in the region that model
experiments indicate should be under the immediate
influence of the northern ice sheets (see Figure 11–4). FIGURE 11-10 Responses of windblown debris in East Asia
These ice-driven responses resulted from altered to ice volume Alternating layers of windblown loess and soils
18
wind patterns that produced changes in surface-ocean in Southeast Asia match variations in δ O (ice volume).
temperatures and precipitation over land. (Adapted from G. Kukla et al., “Pleistocene Climates in China
Dated by Magnetic Susceptibility,” Geology 16 [1988]: 811–14.)