
Page 220 - Earth's Climate Past and Future
P. 220
196 PART III • Orbital-Scale Climate Change
produce melting conditions across the margins of the erably larger than the response at 23,000 years (which
Antarctic ice sheet. Climate was presumably warmer than receives no positive feedback from CO ). As in the “small
2
now during the interval between 2.75 and 0.9 Myr ago, glaciation” phase (Chapter 9), ice sheets would appear
but was it warm enough for major ice melting to have during summer insolation minima (mainly at the 41,000-
occurred during favorable orbital configurations? year cycle) but melt away during the next insolation
maximum.
11-3 CO Feedback at 41,000 Years? One problem with this explanation is that climate sci-
2
The marine geologist Bill Ruddiman has proposed that entists do not know how to weigh the effect on ice sheets
ice sheets varied mainly at a 41,000-year tempo because of changes in insolation compared to changes in green-
of positive feedback from CO . During the last 400,000 house gases. Expressed in units of Watts per square
2 2
years, CO variations at the 41,000-year cycles have meter (W/m ), the relative heating effects of the insola-
2
been in phase with and therefore driven by the ice sheets tion changes are much larger than those of the green-
(Chapter 10). Although no ice cores have yet reached house gases. On the other hand, the greenhouse-gas
back to the 41,000-year glacial regime, Ruddiman changes persist through the year, whereas the insolation
suggested that this same relationship would also have changes trend in opposite directions during summer and
prevailed during the 2.75–0.9 Myr interval. winter. A second problem is that the reason CO acts as
2
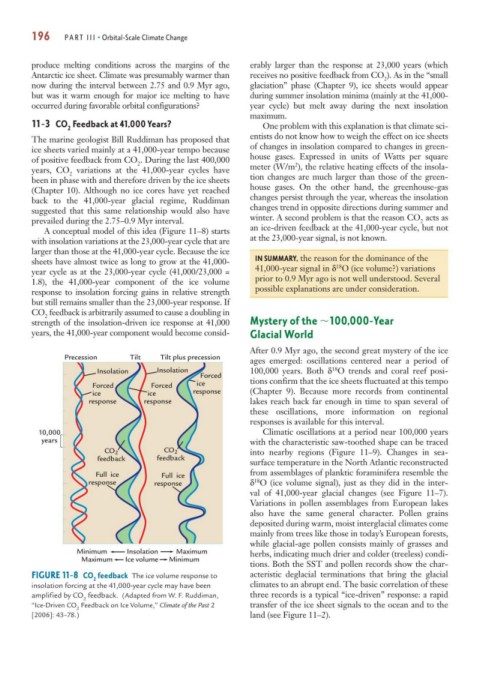
A conceptual model of this idea (Figure 11–8) starts an ice-driven feedback at the 41,000-year cycle, but not
with insolation variations at the 23,000-year cycle that are at the 23,000-year signal, is not known.
larger than those at the 41,000-year cycle. Because the ice
sheets have almost twice as long to grow at the 41,000- IN SUMMARY, the reason for the dominance of the
18
year cycle as at the 23,000-year cycle (41,000/23,000 = 41,000-year signal in δ O (ice volume?) variations
1.8), the 41,000-year component of the ice volume prior to 0.9 Myr ago is not well understood. Several
response to insolation forcing gains in relative strength possible explanations are under consideration.
but still remains smaller than the 23,000-year response. If
CO feedback is arbitrarily assumed to cause a doubling in
2
strength of the insolation-driven ice response at 41,000 Mystery of the 100,000-Year
years, the 41,000-year component would become consid- Glacial World
After 0.9 Myr ago, the second great mystery of the ice
Precession Tilt Tilt plus precession
ages emerged: oscillations centered near a period of
18
Insolation Insolation 100,000 years. Both δ O trends and coral reef posi-
Forced
Forced Forced ice tions confirm that the ice sheets fluctuated at this tempo
ice ice response (Chapter 9). Because more records from continental
response response lakes reach back far enough in time to span several of
these oscillations, more information on regional
responses is available for this interval.
10,000 Climatic oscillations at a period near 100,000 years
years with the characteristic saw-toothed shape can be traced
CO 2 CO 2 into nearby regions (Figure 11–9). Changes in sea-
feedback feedback
surface temperature in the North Atlantic reconstructed
Full ice Full ice from assemblages of planktic foraminifera resemble the
18
response response δ O (ice volume signal), just as they did in the inter-
val of 41,000-year glacial changes (see Figure 11–7).
Variations in pollen assemblages from European lakes
also have the same general character. Pollen grains
deposited during warm, moist interglacial climates come
mainly from trees like those in today’s European forests,
while glacial-age pollen consists mainly of grasses and
Minimum Insolation Maximum herbs, indicating much drier and colder (treeless) condi-
Maximum Ice volume Minimum
tions. Both the SST and pollen records show the char-
FIGURE 11-8 CO feedback The ice volume response to acteristic deglacial terminations that bring the glacial
2
insolation forcing at the 41,000-year cycle may have been climates to an abrupt end. The basic correlation of these
amplified by CO feedback. (Adapted from W. F. Ruddiman, three records is a typical “ice-driven” response: a rapid
2
“Ice-Driven CO Feedback on Ice Volume,” Climate of the Past 2 transfer of the ice sheet signals to the ocean and to the
2
[2006]: 43–78.) land (see Figure 11–2).