
Page 223 - Earth's Climate Past and Future
P. 223
CHAPTER 11 • Orbital-Scale Interactions, Feedbacks, and Unsolved Problems 199
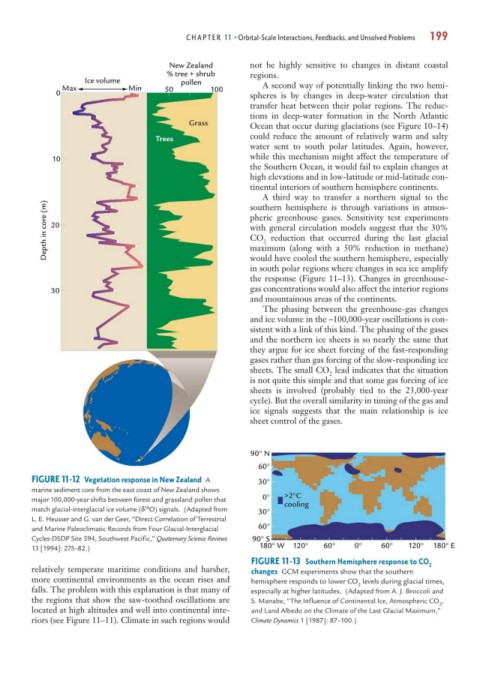
New Zealand not be highly sensitive to changes in distant coastal
% tree + shrub regions.
Ice volume pollen
Max Min 50 100 A second way of potentially linking the two hemi-
0 spheres is by changes in deep-water circulation that
transfer heat between their polar regions. The reduc-
tions in deep-water formation in the North Atlantic
Grass Ocean that occur during glaciations (see Figure 10–14)
Trees could reduce the amount of relatively warm and salty
water sent to south polar latitudes. Again, however,
10 while this mechanism might affect the temperature of
the Southern Ocean, it would fail to explain changes at
high elevations and in low-latitude or mid-latitude con-
tinental interiors of southern hemisphere continents.
A third way to transfer a northern signal to the
Depth in core (m) 20 pheric greenhouse gases. Sensitivity test experiments
southern hemisphere is through variations in atmos-
with general circulation models suggest that the 30%
CO reduction that occurred during the last glacial
2
maximum (along with a 50% reduction in methane)
would have cooled the southern hemisphere, especially
in south polar regions where changes in sea ice amplify
the response (Figure 11–13). Changes in greenhouse-
30 gas concentrations would also affect the interior regions
and mountainous areas of the continents.
The phasing between the greenhouse-gas changes
and ice volume in the ~100,000-year oscillations is con-
sistent with a link of this kind. The phasing of the gases
and the northern ice sheets is so nearly the same that
they argue for ice sheet forcing of the fast-responding
gases rather than gas forcing of the slow-responding ice
sheets. The small CO lead indicates that the situation
2
is not quite this simple and that some gas forcing of ice
sheets is involved (probably tied to the 23,000-year
cycle). But the overall similarity in timing of the gas and
ice signals suggests that the main relationship is ice
sheet control of the gases.
90° N
60°
FIGURE 11-12 Vegetation response in New Zealand A 30°
marine sediment core from the east coast of New Zealand shows
major 100,000-year shifts between forest and grassland pollen that 0° >2°C
cooling
match glacial-interglacial ice volume (δ O) signals. (Adapted from 30°
18
L. E. Heusser and G. van der Geer, “Direct Correlation of Terrestrial
and Marine Paleoclimatic Records from Four Glacial-Interglacial 60°
Cycles-DSDP Site 594, Southwest Pacific,” Quaternary Science Reviews 90° S
13 [1994]: 275–82.) 180° W 120° 60° 0° 60° 120° 180° E
FIGURE 11-13 Southern Hemisphere response to CO 2
relatively temperate maritime conditions and harsher, changes GCM experiments show that the southern
more continental environments as the ocean rises and hemisphere responds to lower CO levels during glacial times,
2
falls. The problem with this explanation is that many of especially at higher latitudes. (Adapted from A. J. Broccoli and
the regions that show the saw-toothed oscillations are S. Manabe, “The Influence of Continental Ice, Atmospheric CO ,
2
located at high altitudes and well into continental inte- and Land Albedo on the Climate of the Last Glacial Maximum,”
riors (see Figure 11–11). Climate in such regions would Climate Dynamics 1 [1987]: 87–100.)