
Page 228 - Earth's Climate Past and Future
P. 228
204 PART III • Orbital-Scale Climate Change
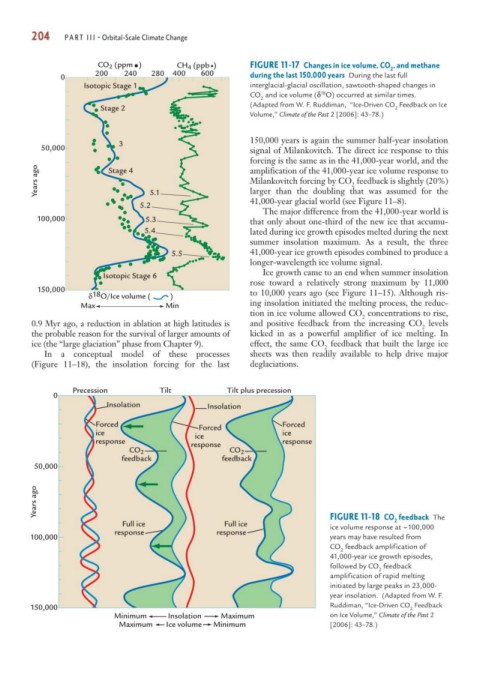
CO 2 (ppm ) CH 4 (ppb ) FIGURE 11-17 Changes in ice volume, CO , and methane
2
200 240 280 400 600
0 during the last 150,000 years During the last full
Isotopic Stage 1 interglacial-glacial oscillation, sawtooth-shaped changes in
18
CO and ice volume (δ O) occurred at similar times.
2
(Adapted from W. F. Ruddiman, “Ice-Driven CO Feedback on Ice
Stage 2 2
Volume,” Climate of the Past 2 [2006]: 43–78.)
150,000 years is again the summer half-year insolation
3
50,000 signal of Milankovitch. The direct ice response to this
forcing is the same as in the 41,000-year world, and the
Years ago Stage 4 amplification of the 41,000-year ice volume response to
Milankovitch forcing by CO feedback is slightly (20%)
2
larger than the doubling that was assumed for the
5.1
41,000-year glacial world (see Figure 11–8).
5.2
The major difference from the 41,000-year world is
100,000 5.3 that only about one-third of the new ice that accumu-
5.4 lated during ice growth episodes melted during the next
summer insolation maximum. As a result, the three
5.5 41,000-year ice growth episodes combined to produce a
longer-wavelength ice volume signal.
Ice growth came to an end when summer insolation
Isotopic Stage 6
rose toward a relatively strong maximum by 11,000
150,000
δ 18 O/Ice volume ( ) to 10,000 years ago (see Figure 11–15). Although ris-
Max Min ing insolation initiated the melting process, the reduc-
tion in ice volume allowed CO concentrations to rise,
2
0.9 Myr ago, a reduction in ablation at high latitudes is and positive feedback from the increasing CO levels
2
the probable reason for the survival of larger amounts of kicked in as a powerful amplifier of ice melting. In
ice (the “large glaciation” phase from Chapter 9). effect, the same CO feedback that built the large ice
2
In a conceptual model of these processes sheets was then readily available to help drive major
(Figure 11–18), the insolation forcing for the last deglaciations.
Precession Tilt Tilt plus precession
0
Insolation Insolation
Forced Forced Forced
ice ice ice
response response
response
CO 2 CO 2
feedback feedback
50,000
Years ago
2
Full ice Full ice FIGURE 11-18 CO feedback The
ice volume response at 100,000
response response ~
100,000 years may have resulted from
CO feedback amplification of
2
41,000-year ice growth episodes,
followed by CO feedback
2
amplification of rapid melting
initiated by large peaks in 23,000-
year insolation. (Adapted from W. F.
150,000 Ruddiman, “Ice-Driven CO Feedback
2
Minimum Insolation Maximum on Ice Volume,” Climate of the Past 2
Maximum Ice volume Minimum [2006]: 43–78.)