
Page 219 - Earth's Climate Past and Future
P. 219
CHAPTER 11 • Orbital-Scale Interactions, Feedbacks, and Unsolved Problems 195
Northern ice Southern ice Global ice similarity of the two trends during this interval suggests
(meters (meters (meters that the northern ice sheets varied mainly at the 41,000-
sea level) sea level) sea level) year tempo indicated by the δ O trend. Similar evidence
18
–80–60 –40–20 0 –40 –20 0 –60 –40 –20 0 20 comes from 41,000-year alternations between deposits of
1.0
weathered soils (indicating warm wet conditions) and
windblown loess (indicating cold dry conditions) in the
loess plateau of southeast Asia (see Figure 2–3). This
plateau is built of layered sequences of sediments hun-
dreds of meters thick.
A second issue is whether the Antarctic ice sheet would
have been able to respond to orbital forcing during the
interval between 2.75 and 0.9 Myr. Even during the inter-
glacial climates of the last several hundred thousand years
(including today), Antarctica appears to have remained
Myr ago 1.5 deeply refrigerated, with temperatures barely reaching the
freezing point around the margins of the continent even in
midsummer. General circulation modeling experiments
suggest that a very large warming would be required to
Ice sheets North Atlantic
Larger Smaller surface temperature
18
δ O (‰) (°C)
5 4 3 5 10 15 20
1.2
2.0
FIGURE 11-6 Interhemispheric cancellation The response
of northern hemisphere ice sheets to summer insolation forcing
at the 23,000-year cycle may have been offset by a response of
Antarctic ice to summer insolation with opposite timing.
Raymo proposed that these oppositely phased inso- 1.3
lation changes drove similarly opposed ice volume re-
sponses in the two hemispheres (Figure 11–6). When
northern ice sheets were growing, the Antarctic ice sheet
was shrinking; the converse is also true. As a result, the Myr ago
effects of the northern and southern ice sheets on the
global δ O signal were also opposed. The δ O compo-
18
18
sition of the Antarctic ice sheet was also considerably
more negative (–50 to –55‰) than that of the northern 1.4
ice sheets (–30 to –35‰, the composition of Greenland
ice). As a result, changes in the volume of Antarctic
ice had to be only about 60% as large as those in the
northern hemisphere to cancel them out in the global
average value recorded in marine δ O records (32‰
18
divided by 52‰).
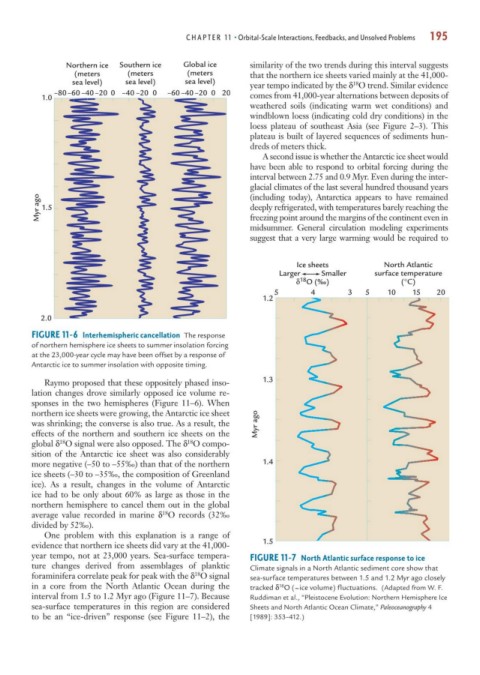
One problem with this explanation is a range of
evidence that northern ice sheets did vary at the 41,000- 1.5
year tempo, not at 23,000 years. Sea-surface tempera- FIGURE 11-7 North Atlantic surface response to ice
ture changes derived from assemblages of planktic Climate signals in a North Atlantic sediment core show that
foraminifera correlate peak for peak with the δ O signal sea-surface temperatures between 1.5 and 1.2 Myr ago closely
18
in a core from the North Atlantic Ocean during the tracked δ O ( ice volume) fluctuations. (Adapted from W. F.
18
~
interval from 1.5 to 1.2 Myr ago (Figure 11–7). Because Ruddiman et al., “Pleistocene Evolution: Northern Hemisphere Ice
sea-surface temperatures in this region are considered Sheets and North Atlantic Ocean Climate,” Paleoceanography 4
to be an “ice-driven” response (see Figure 11–2), the [1989]: 353–412.)