
Page 213 - Earth's Climate Past and Future
P. 213
CHAPTER 10 • Orbital-Scale Changes in Carbon Dioxide and Methane 189
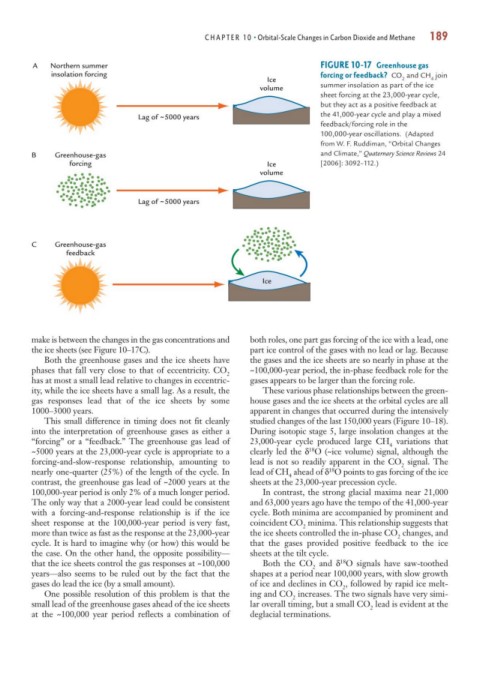
A Northern summer FIGURE 10-17 Greenhouse gas
insolation forcing forcing or feedback? CO and CH join
Ice 2 4
volume summer insolation as part of the ice
sheet forcing at the 23,000-year cycle,
but they act as a positive feedback at
the 41,000-year cycle and play a mixed
Lag of 5000 years
~
feedback/forcing role in the
100,000-year oscillations. (Adapted
from W. F. Ruddiman, “Orbital Changes
B Greenhouse-gas and Climate,” Quaternary Science Reviews 24
forcing Ice [2006]: 3092–112.)
volume
Lag of 5000 years
~
C Greenhouse-gas
feedback
Ice
make is between the changes in the gas concentrations and both roles, one part gas forcing of the ice with a lead, one
the ice sheets (see Figure 10–17C). part ice control of the gases with no lead or lag. Because
Both the greenhouse gases and the ice sheets have the gases and the ice sheets are so nearly in phase at the
phases that fall very close to that of eccentricity. CO ~100,000-year period, the in-phase feedback role for the
2
has at most a small lead relative to changes in eccentric- gases appears to be larger than the forcing role.
ity, while the ice sheets have a small lag. As a result, the These various phase relationships between the green-
gas responses lead that of the ice sheets by some house gases and the ice sheets at the orbital cycles are all
1000–3000 years. apparent in changes that occurred during the intensively
This small difference in timing does not fit cleanly studied changes of the last 150,000 years (Figure 10–18).
into the interpretation of greenhouse gases as either a During isotopic stage 5, large insolation changes at the
“forcing” or a “feedback.” The greenhouse gas lead of 23,000-year cycle produced large CH variations that
4
18
~5000 years at the 23,000-year cycle is appropriate to a clearly led the δ O (~ice volume) signal, although the
forcing-and-slow-response relationship, amounting to lead is not so readily apparent in the CO signal. The
2
18
nearly one-quarter (25%) of the length of the cycle. In lead of CH ahead of δ O points to gas forcing of the ice
4
contrast, the greenhouse gas lead of ~2000 years at the sheets at the 23,000-year precession cycle.
100,000-year period is only 2% of a much longer period. In contrast, the strong glacial maxima near 21,000
The only way that a 2000-year lead could be consistent and 63,000 years ago have the tempo of the 41,000-year
with a forcing-and-response relationship is if the ice cycle. Both minima are accompanied by prominent and
sheet response at the 100,000-year period is very fast, coincident CO minima. This relationship suggests that
2
more than twice as fast as the response at the 23,000-year the ice sheets controlled the in-phase CO changes, and
2
cycle. It is hard to imagine why (or how) this would be that the gases provided positive feedback to the ice
the case. On the other hand, the opposite possibility— sheets at the tilt cycle.
18
that the ice sheets control the gas responses at ~100,000 Both the CO and δ O signals have saw-toothed
2
years—also seems to be ruled out by the fact that the shapes at a period near 100,000 years, with slow growth
gases do lead the ice (by a small amount). of ice and declines in CO , followed by rapid ice melt-
2
One possible resolution of this problem is that the ing and CO increases. The two signals have very simi-
2
small lead of the greenhouse gases ahead of the ice sheets lar overall timing, but a small CO lead is evident at the
2
at the ~100,000 year period reflects a combination of deglacial terminations.