
Page 50 - Electric Machinery Fundamentals
P. 50
26 ELEC fRlC MACHlNERY FUNDAMENTALS
i(t)
(a)
1(mB)
---
b
--------cf-F'f---------- \}(m H)
---
(b)
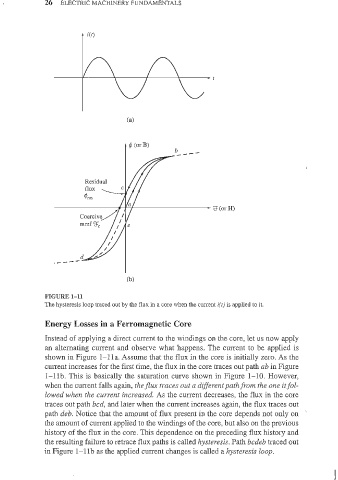
FIGURE 1- 11
The hysteresis loop traced out by the flux in a core when the current i(t) is applied to it.
Energy Losses in a Ferromagnetic Core
Instead of applying a direct current to the windings on the core, let us now apply
an alternating current and observe what happens. The current to be applied is
shown in Figure l-11a. Assume that the flux in the core is initially zero. As the
current increases for the first time, the flux in the core traces out path ab in Figure
I-llb. This is basicalIy the saturation curve shown in Figure 1-10. However,
when the current falls again, the flux traces out a different pathfrom the one itfol-
lowed when the current increased. As the current decreases, the flux in the core
traces out path bcd, and later when the current increases again, the flux traces out
path deb. Notice that the amount of flux present in the core depends not only on
the amount of current applied to the windings of the core, but also on the previous
history of the flux in the core. This dependence on the preceding flux history and
the resulting failure to retrace flux paths is called hysteresis. Path bcdeb traced out
in Figure I-lIb as the applied cun-ent changes is called a hysteresis loop.