
Page 407 - Electrical Properties of Materials
P. 407
The energy gap 389
14.7 The energy gap
As you know from electromagnetic theory, such optical properties as reflectiv-
ity and refractive index are related to the bulk parameters, resistivity, and
dielectric constant. Thus, zero resistivity implies quite radical optical proper-
ties, which are not found experimentally. Nothing untoward happens below the
critical temperature. Hence, we are forced to the conclusion that, somewhere
between zero and light frequencies, the conductivity is restored to its normal
value. What is the mechanism? Having learned band theory, we could describe
a mechanism that might be responsible; this is the existence of an energy gap.
When the frequency is large enough, there is an absorption process, owing to
electrons being excited across the gap. Pairing of electrons is no longer advant-
ageous; all traces of superconductivity disappear. This explanation happens to
be correct and is in agreement with the predictions of the BCS theory.
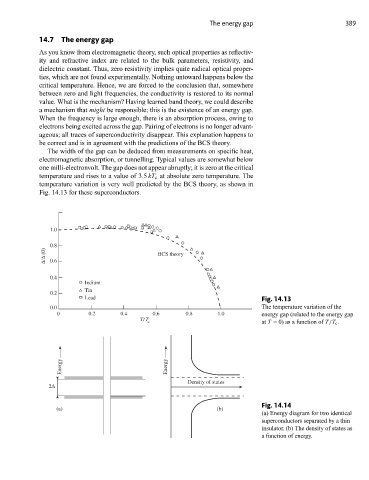
The width of the gap can be deduced from measurements on specific heat,
electromagnetic absorption, or tunnelling. Typical values are somewhat below
one milli-electronvolt. The gap does not appear abruptly; it is zero at the critical
temperature and rises to a value of 3.5 kT c at absolute zero temperature. The
temperature variation is very well predicted by the BCS theory, as shown in
Fig. 14.13 for these superconductors.
1.0
0.8
Δ/Δ (0) 0.6 BCS theory
0.4
Indium
Tin
0.2
Lead Fig. 14.13
0.0 The temperature variation of the
0 0.2 0.4 0.6 0.8 1.0 energy gap (related to the energy gap
T/T
c at T = 0) as a function of T/T c .
Energy Energy
Density of states
2Δ
Fig. 14.14
(a) (b)
(a) Energy diagram for two identical
superconductors separated by a thin
insulator. (b) The density of states as
a function of energy.