
Page 408 - Electrical Properties of Materials
P. 408
390 Superconductivity
2Δ
Fig. 14.15
The energy diagram of Fig. 14.14(a)
when a voltage, 2 /e is applied.
I
When we put a thin insulator between two identical superconductors, the en-
ergy diagram [Fig. 14.14(a)] looks very similar to those we encountered when
studying semiconductors. The essential difference is that in the present case the
density of states is high just above and below the gap, as shown in Fig. 14.14(b).
An applied voltage produces practically no current until the voltage difference
is as large as the gap itself; the situation is shown in Fig. 14.15. If we in-
crease the voltage further, electrons from the left-hand side may tunnel into
empty states on the right-hand side, and the current rises abruptly, as shown in
Fig. 14.16.
0 2Δ V An even more interesting case arises when the two superconductors have
e
different gaps. Since the Fermi level is in the middle of the gap (as for in-
Fig. 14.16 trinsic semiconductors) the energy diagram at thermal equilibrium is as shown
The current as a function of voltage in Fig. 14.17(a). There are some electrons above the gap (and holes below the
for a junction between two identical gap) in superconductor A but hardly any (because of the larger gap) in super-
superconductors separated by a thin conductor B. When a voltage is applied, a current will flow and will increase
insulator.
with voltage (Fig. 14.18) because more and more of the thermally excited elec-
trons in superconductor A can tunnel across the insulator into the available
states of superconductor B. When the applied voltage reaches ( 2 – 1 )/e
[Fig. 14.17(b)], it has become energetically possible for all thermally excited
(a) (b)
(c)
2Δ 2Δ 2Δ 2Δ
1 2 1 2Δ 1
2
2Δ
2
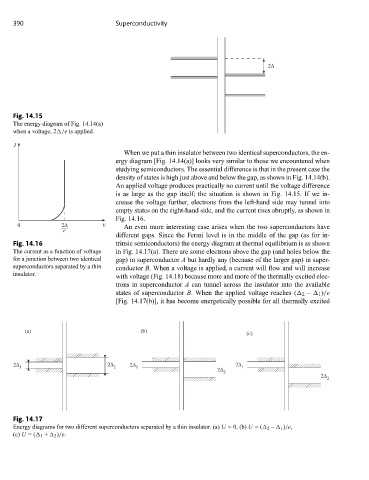
Fig. 14.17
Energy diagrams for two different superconductors separated by a thin insulator. (a) U =0, (b) U =( 2 – 1 )/e,
(c) U =( 1 + 2 )/e.