
Page 38 - Academic Press Encyclopedia of Physical Science and Technology 3rd Chemical Engineering
P. 38
P1: FJD Revised Pages
Encyclopedia of Physical Science and Technology EN001-13 May 7, 2001 12:29
260 Adsorption (Chemical Engineering)
tagged according to the phase of their nuclear spins, during
a known time interval of a few milliseconds. The quan-
tity measured is thus the self-diffusivity D s rather than
the transport diffusivity, since under the conditions of the
experiment there is no concentration gradient. The two
quantities are related, however, by a well-defined rela-
tionship, which in the Henry’s law region reduces simply
to D s = D 0 = lim c→0 D.
VI. ADSORPTION COLUMN DYNAMICS
In most adsorption processes the adsorbent is contacted
with fluid in a packed bed. The analysis and rational de-
sign of such processes therefore require an understanding
of the dynamic behavior of such systems. What is required
is a mathematical model which will allow the effluent
concentration to be predicted for any defined change in
feed concentration, but two simple situations are of special
interest:
1. The response of a column, initially at equilibrium
with the feed stream, to a step change in the
concentration of an adsorbable species in the feed.
This is referred to as the breakthrough curve (for a
concentration increase) or the desorption curve (for a
concentration decrease). The simplest case is a clean
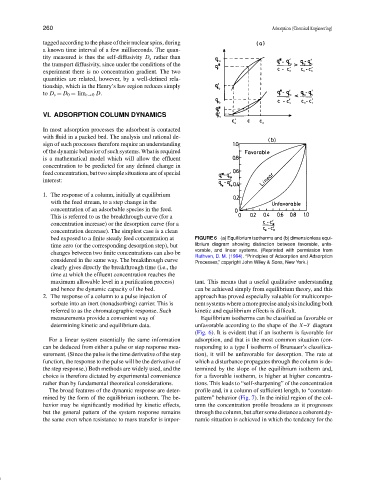
bed exposed to a finite steady feed concentration at FIGURE 6 (a) Equilibrium isotherms and (b) dimensionless equi-
time zero (or the corresponding desorption step), but librium diagram showing distinction between favorable, unfa-
vorable, and linear systems. (Reprinted with permission from
changes between two finite concentrations can also be
Ruthven, D. M. (1984). “Principles of Adsorption and Adsorption
considered in the same way. The breakthrough curve
Processes,” copyright John Wiley & Sons, New York.)
clearly gives directly the breakthrough time (i.e., the
time at which the effluent concentration reaches the
maximum allowable level in a purification process) tant. This means that a useful qualitative understanding
and hence the dynamic capacity of the bed. can be achieved simply from equilibrium theory, and this
2. The response of a column to a pulse injection of approach has proved especially valuable for multicompo-
sorbate into an inert (nonadsorbing) carrier. This is nent systems where a more precise analysis including both
referred to as the chromatographic response. Such kinetic and equilibrium effects is difficult.
measurements provide a convenient way of Equilibrium isotherms can be classified as favorable or
determining kinetic and equilibrium data. unfavorable according to the shape of the X–Y diagram
(Fig. 6). It is evident that if an isotherm is favorable for
For a linear system essentially the same information adsorption, and that is the most common situation (cor-
can be deduced from either a pulse or step response mea- responding to a type I isotherm of Brunauer’s classifica-
surement. (Since the pulse is the time derivative of the step tion), it will be unfavorable for desorption. The rate at
function, the response to the pulse will be the derivative of which a disturbance propagates through the column is de-
the step response.) Both methods are widely used, and the termined by the slope of the equilibrium isotherm and,
choice is therefore dictated by experimental convenience for a favorable isotherm, is higher at higher concentra-
rather than by fundamental theoretical considerations. tions. This leads to “self-sharpening” of the concentration
The broad features of the dynamic response are deter- profile and, in a column of sufficient length, to “constant-
mined by the form of the equilibrium isotherm. The be- pattern” behavior (Fig. 7). In the initial region of the col-
havior may be significantly modified by kinetic effects, umn the concentration profile broadens as it progresses
but the general pattern of the system response remains through the column, but after some distance a coherent dy-
the same even when resistance to mass transfer is impor- namic situation is achieved in which the tendency for the