
Page 431 - Academic Press Encyclopedia of Physical Science and Technology 3rd Chemical Engineering
P. 431
P1: GLQ/GUB P2: GQT Final Pages
Encyclopedia of Physical Science and Technology EN012I-591 July 26, 2001 15:54
Pollution Prevention from Chemical Processes 597
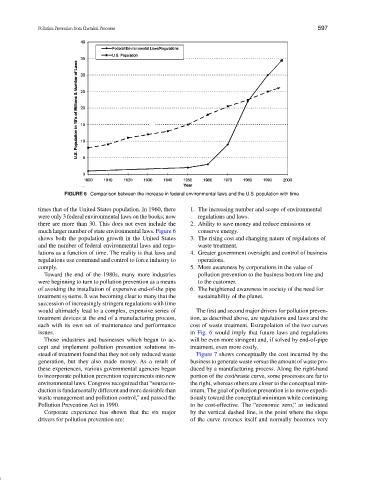
FIGURE 6 Comparison between the increase in federal environmental laws and the U.S. population with time.
times that of the United States population. In 1960, there 1. The increasing number and scope of environmental
were only 3 federal environmental laws on the books; now regulations and laws.
there are more than 30. This does not even include the 2. Ability to save money and reduce emissions or
much larger number of state environmental laws. Figure 6 conserve energy.
shows both the population growth in the United States 3. The rising cost and changing nature of regulations of
and the number of federal environmental laws and regu- waste treatment.
lations as a function of time. The reality is that laws and 4. Greater government oversight and control of business
regulations use command and control to force industry to operations.
comply. 5. More awareness by corporations in the value of
Toward the end of the 1980s, many more industries pollution prevention to the business bottom line and
were beginning to turn to pollution prevention as a means to the customer.
of avoiding the installation of expensive end-of-the pipe 6. The heightened awareness in society of the need for
treatment systems. It was becoming clear to many that the sustainability of the planet.
succession of increasingly stringent regulations with time
would ultimately lead to a complex, expensive series of The first and second major drivers for pollution preven-
treatment devices at the end of a manufacturing process, tion, as described above, are regulations and laws and the
each with its own set of maintenance and performance cost of waste treatment. Extrapolation of the two curves
issues. in Fig. 6 would imply that future laws and regulations
Those industries and businesses which began to ac- will be even more stringent and, if solved by end-of-pipe
cept and implement pollution prevention solutions in- treatment, even more costly.
stead of treatment found that they not only reduced waste Figure 7 shows conceptually the cost incurred by the
generation, but they also made money. As a result of business to generate waste versus the amount of waste pro-
these experiences, various governmental agencies began duced by a manufacturing process. Along the right-hand
to incorporate pollution prevention requirements into new portion of the cost/waste curve, some processes are far to
environmental laws. Congress recognized that “source re- the right, whereas others are closer to the conceptual min-
duction is fundamentally different and more desirable than imum. The goal of pollution prevention is to move expedi-
waste management and pollution control,” and passed the tiously toward the conceptual minimum while continuing
Pollution Prevention Act in 1990. to be cost-effective. The “economic zero,” as indicated
Corporate experience has shown that the six major by the vertical dashed line, is the point where the slope
drivers for pollution prevention are: of the curve reverses itself and normally becomes very