
Page 82 - Academic Press Encyclopedia of Physical Science and Technology 3rd Chemical Engineering
P. 82
P1: LLL Revised Pages
Encyclopedia of Physical Science and Technology EN002E-49 May 17, 2001 20:13
46 Batch Processing
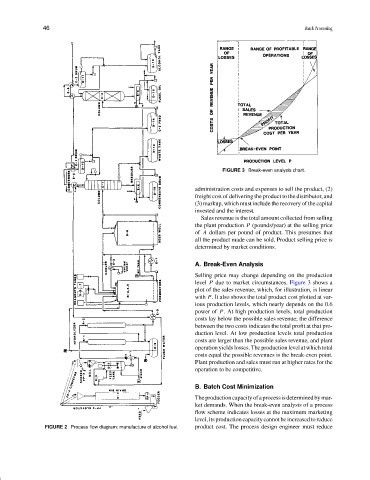
FIGURE 3 Break-even analysis chart.
administration costs and expenses to sell the product, (2)
freight cost of delivering the product to the distributor, and
(3) markup, which must include the recovery of the capital
invested and the interest.
Sales revenue is the total amount collected from selling
the plant production P (pounds/year) at the selling price
of A dollars per pound of product. This presumes that
all the product made can be sold. Product selling price is
determined by market conditions.
A. Break-Even Analysis
Selling price may change depending on the production
level P due to market circumstances. Figure 3 shows a
plot of the sales revenue, which, for illustration, is linear
with P. It also shows the total product cost plotted at var-
ious production levels, which nearly depends on the 0.6
power of P. At high production levels, total production
costs lay below the possible sales revenue; the difference
between the two costs indicates the total profit at that pro-
duction level. At low production levels total production
costs are larger than the possible sales revenue, and plant
operation yields losses. The production level at which total
costs equal the possible revenues is the break-even point.
Plant production and sales must run at higher rates for the
operation to be competitive.
B. Batch Cost Minimization
Theproductioncapacityofaprocessisdeterminedbymar-
ket demands. When the break-even analysis of a process
flow scheme indicates losses at the maximum marketing
level, its production capacity cannot be increased to reduce
FIGURE 2 Process flow diagram: manufacture of alcohol fuel. product cost. The process design engineer must reduce