
Page 285 - Academic Press Encyclopedia of Physical Science and Technology 3rd Analytical Chemistry
P. 285
P1: GNH Final Pages
Encyclopedia of Physical Science and Technology EN009N-447 July 19, 2001 23:3
802 Microwave Molecular Spectroscopy
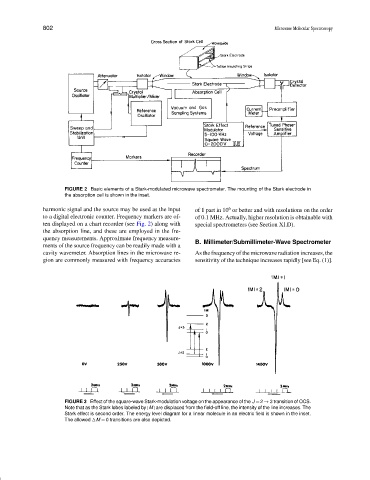
FIGURE 2 Basic elements of a Stark-modulated microwave spectrometer. The mounting of the Stark electrode in
the absorption cell is shown in the inset.
6
harmonic signal and the source may be used as the input of 1 part in 10 or better and with resolutions on the order
to a digital electronic counter. Frequency markers are of- of 0.1 MHz. Actually, higher resolution is obtainable with
ten displayed on a chart recorder (see Fig. 2) along with special spectrometers (see Section XI.D).
the absorption line, and these are employed in the fre-
quency measurements. Approximate frequency measure- B. Millimeter/Submillimeter-Wave Spectrometer
ments of the source frequency can be readily made with a
cavity wavemeter. Absorption lines in the microwave re- As the frequency of the microwave radiation increases, the
gion are commonly measured with frequency accuracies sensitivity of the technique increases rapidly [see Eq. (1)].
FIGURE 3 Effect of the square-wave Stark-modulation voltage on the appearance of the J = 2 → 3 transition of OCS.
Note that as the Stark lobes labeled by |M| are displaced from the field-off line, the intensity of the line increases. The
Stark effect is second order. The energy level diagram for a linear molecule in an electric field is shown in the inset.
The allowed M = 0 transitions are also depicted.