
Page 286 - Academic Press Encyclopedia of Physical Science and Technology 3rd Analytical Chemistry
P. 286
P1: GNH Final Pages
Encyclopedia of Physical Science and Technology EN009N-447 July 19, 2001 23:3
Microwave Molecular Spectroscopy 803
Moreover, many small, fundamental molecules have spec- C. Line Intensities and Shapes
tra which fall in the shorter wavelength region. For these
A few comments on the shapes and factors affecting line
reasons, spectrometers have been developed operating at
intensities are in order. An absorption line is not perfectly
higher frequencies. This is accomplished by harmonic
sharp but is usually symmetrical about the resonant fre-
generation of the higher frequencies from a high-powered,
quency. It is characterized by its resonant frequency ν 0 , its
lower frequency source using a point-contact crystal diode
shape, and its linewidth 2( ν), where ν is the half-width
harmonicgenerator.Developmentofthisandvariousother
at half-intensity points of the line. At very low pressures,
techniques to exploit the millimeter- and submillimeter- −3 −3
<10 mTorr (1 mTorr = 10 Torr = 1 µm = 10 mm of
wave regions was pioneered by Walter Gordy and his
Hg), the linewidth arises primarily from Doppler broad-
research group. In the shorter wavelength region, quasi-
ening and is independent of pressure, and the line shape
optical techniques can be used, and more versatile ab-
is Gaussian. This is the region of maximum resolution.
sorption cell designs are possible. The Stark cell is usu-
As the pressure is raised in this region, the peak line in-
ally replaced by a quasi-free space cell. Both metal and
tensity increases, while the linewidth remains constant.
glass cells have been employed. Radiation transmission
As the pressure is further increased, collision broadening
through the adsorption cell is properly matched to the
becomes important. At pressures >10 mTorr, broadening
waveguide by employing waveguide horns equipped with
due to molecular collisions becomes dominant. The line
a Teflon lens (see Fig. 26). A block diagram of a broadband
shape is now Lorentzian, the half-width is directly propor-
millimeter/submillimeter-wave spectrometer is given in
tional to the pressure ν = kp, and the peak intensity is
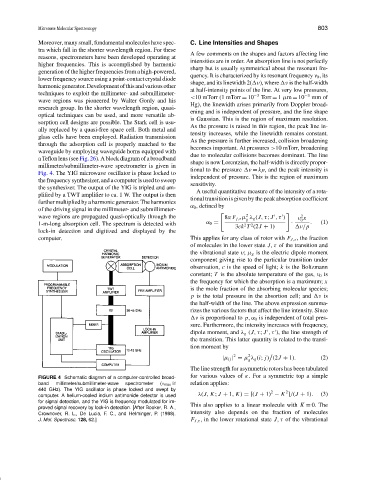
Fig. 4. The YIG microwave oscillator is phase locked to
independent of pressure. This is the region of maximum
the frequency synthesizer, and a computer is used to sweep
sensitivity.
the synthesizer. The output of the YIG is tripled and am-
A useful quantitative measure of the intensity of a rota-
plified by a TWT amplifier to ca. 1 W. The output is then
tional transition is given by the peak absorption coefficient
further multiplied bya harmonic generator.The harmonics
α 0 ,defined by
of the driving signal in the millimeter- and submillimeter-
2
wave regions are propagated quasi-optically through the 8π F j,τ µ λ g (J,τ; J ,τ ) 2
g ν x
0
1-m-long absorption cell. The spectrum is detected with α 0 = 2 2 · . (1)
3ck T (2J + 1) ν/p
lock-in detection and digitized and displayed by the
computer. This applies for any class of rotor with F J,τ , the fraction
of molecules in the lower state J,τ of the transition and
the vibrational state v; µ g is the electric dipole moment
component giving rise to the particular transition under
observation, c is the speed of light; k is the Boltzmann
constant; T is the absolute temperature of the gas, ν 0 is
the frequency for which the absorption is a maximum; x
is the mole fraction of the absorbing molecular species;
p is the total pressure in the absortion cell; and ν is
the half-width of the line. The above expression summa-
rizes the various factors that affect the line intensity. Since
ν is proportional to p,α 0 is independent of total pres-
sure. Furthermore, the intensity increases with frequency,
dipole moment, and λ g (J,τ; J ,τ ), the line strength of
the transition. This latter quantity is related to the transi-
tion moment by
2
2
|µ ij | = µ λ g (i; j) (2J + 1). (2)
g
The line strength for asymmetric rotors has been tabulated
for various values of κ. For a symmetric top a simple
FIGURE 4 Schematic diagram of a computer-controlled broad-
∼
band millimeter/submillimeter-wave spectrometer (ν max = relation applies:
440 GHz). The YIG oscillator is phase locked and swept by 2 2
computer. A helium-cooled indium antimonide detector is used λ(J, K; J + 1, K) = [(J + 1) − K ]/(J + 1). (3)
for signal detection, and the YIG is frequency modulated for im-
proved signal recovery by lock-in detection. [After Booker, R. A., This also applies to a linear molecule with K = 0. The
Crownover, R. L., De Lucia, F. C., and Helminger, P. (1988). intensity also depends on the fraction of molecules
J. Mol. Spectrosc. 128, 62.] F J,τ , in the lower rotational state J,τ of the vibrational