
Page 61 - Academic Press Encyclopedia of Physical Science and Technology 3rd Analytical Chemistry
P. 61
P1: FYK/LSX Revised Pages P2: FWQ/FPW QC: FYD
Encyclopedia of Physical Science and Technology en001d42 April 28, 2001 15:9
Atomic Spectrometry 785
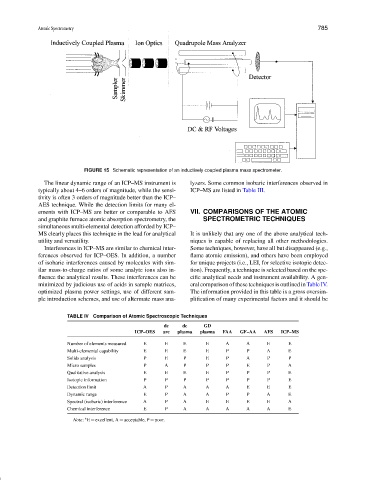
FIGURE 15 Schematic representation of an inductively coupled plasma mass spectrometer.
The linear dynamic range of an ICP–MS instrument is lyzers. Some common isobaric interferences observed in
typically about 4–6 orders of magnitude, while the sensi- ICP–MS are listed in Table III.
tivity is often 3 orders of magnitude better than the ICP–
AES technique. While the detection limits for many el-
ements with ICP–MS are better or comparable to AFS VII. COMPARISONS OF THE ATOMIC
and graphite furnace atomic absorption spectrometry, the SPECTROMETRIC TECHNIQUES
simultaneous multi-elemental detection afforded by ICP–
MS clearly places this technique in the lead for analytical It is unlikely that any one of the above analytical tech-
utility and versatility. niques is capable of replacing all other methodologies.
Interferences in ICP–MS are similar to chemical inter- Some techniques, however, have all but disappeared (e.g.,
ferences observed for ICP–OES. In addition, a number flame atomic emission), and others have been employed
of isobaric interferences caused by molecules with sim- for unique projects (i.e., LEI, for selective isotopic detec-
ilar mass-to-charge ratios of some analyte ions also in- tion). Frequently, a technique is selected based on the spe-
fluence the analytical results. These interferences can be cific analytical needs and instrument availability. A gen-
minimized by judicious use of acids in sample matrices, eral comparison of these techniques is outlined in Table IV.
optimized plasma power settings, use of different sam- The information provided in this table is a gross oversim-
ple introduction schemes, and use of altermate mass ana- plification of many experimental factors and it should be
TABLE IV Comparison of Atomic Spectroscopic Techniques
dc dc GD
ICP–OES arc plasma plasma FAA GF–AA AFS ICP–MS
Number of elements measured E E E E A A E E
Multi-elemental capability E E E E P P A E
Solids analysis P E P E P A P P
Micro samples P A P P P E P A
Qualitative analysis E E E E P P P E
Isotopic information P P P P P P P E
Detection limit A P A A A E E E
Dynamic range E P A A P P A E
Spectral (isobaric) interference A P A E E E E A
Chemical interference E P A A A A A E
Note: E = excellent, A = acceptable, P = poor.
∗