
Page 326 - Academic Press Encyclopedia of Physical Science and Technology 3rd Polymer
P. 326
P1: GQQ/GLT P2: GRB Final Pages
Encyclopedia of Physical Science and Technology EN014B-670 July 28, 2001 16:50
392 Rubber, Natural
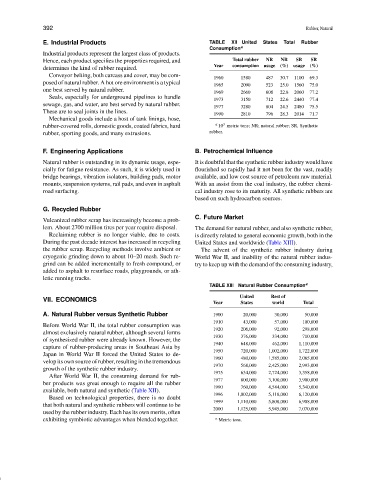
E. Industrial Products TABLE XII United States Total Rubber
Consumption a
Industrial products represent the largest class of products.
Hence, each product specifies the properties required, and Total rubber NR NR SR SR
determines the kind of rubber required. Year consumption usage (%) usage (%)
Conveyor belting, both carcass and cover, may be com-
1960 1580 487 30.7 1100 69.3
posed of natural rubber. A hot ore environment is a typical
1965 2090 523 25.0 1560 75.0
one best served by natural rubber.
1969 2660 608 22.8 2060 77.2
Seals, especially for underground pipelines to handle
1973 3150 712 22.6 2440 77.4
sewage, gas, and water, are best served by natural rubber.
1977 3280 804 24.5 2480 75.5
These are to seal joints in the lines.
1990 2810 796 28.3 2014 71.7
Mechanical goods include a host of tank linings, hose,
3
rubber-covered rolls, domestic goods, coated fabrics, hard a 10 metric tons; NR; natural rubber; SR, Synthetic
rubber, sporting goods, and many extrusions. rubber.
F. Engineering Applications B. Petrochemical Influence
Natural rubber is outstanding in its dynamic usage, espe- It is doubtful that the synthetic rubber industry would have
cially for fatigue resistance. As such, it is widely used in flourished so rapidly had it not been for the vast, readily
bridge bearings, vibration isolators, building pads, motor available, and low cost source of petroleum raw material.
mounts, suspension systems, rail pads, and even in asphalt With an assist from the coal industry, the rubber chemi-
road surfacing. cal industry rose to its maturity. All synthetic rubbers are
based on such hydrocarbon sources.
G. Recycled Rubber
C. Future Market
Vulcanized rubber scrap has increasingly become a prob-
lem. About 2700 million tires per year require disposal. The demand for natural rubber, and also synthetic rubber,
Reclaiming rubber is no longer viable, due to costs. is directly related to general economic growth, both in the
During the past decade interest has increased in recycling United States and worldwide (Table XIII).
the rubber scrap. Recycling methods involve ambient or The advent of the synthetic rubber industry during
cryogenic grinding down to about 10–20 mesh. Such re- World War II, and inability of the natural rubber indus-
grind can be added incrementally to fresh compound, or try to keep up with the demand of the consuming industry,
added to asphalt to resurface roads, playgrounds, or ath-
letic running tracks.
TABLE XIII Natural Rubber Consumption a
United Rest of
VII. ECONOMICS
Year States world Total
A. Natural Rubber versus Synthetic Rubber 1900 20,000 30,000 50,000
1910 43,000 57,000 100,000
Before World War II, the total rubber consumption was
1920 206,000 92,000 298,000
almost exclusively natural rubber, although several forms
1930 376,000 334,000 710,000
of synthesized rubber were already known. However, the
1940 648,000 462,000 1,110,000
capture of rubber-producing areas in Southeast Asia by
1950 720,000 1,002,000 1,722,000
Japan in World War II forced the United States to de-
1960 480,000 1,585,000 2,065,000
velop its own source of rubber, resulting in the tremendous
1970 568,000 2,425,000 2,993,000
growth of the synthetic rubber industry.
1975 634,000 2,724,000 3,358,000
After World War II, the consuming demand for rub-
1977 800,000 3,100,000 3,900,000
ber products was great enough to require all the rubber
1990 760,000 4,544,000 5,340,000
available, both natural and synthetic (Table XII).
1996 1,002,000 5,118,000 6,120,000
Based on technological properties, there is no doubt
1999 1,110,000 5,808,000 6,908,000
that both natural and synthetic rubbers will continue to be
2000 1,125,000 5,945,000 7,070,000
used by the rubber industry. Each has its own merits, often
exhibiting symbiotic advantages when blended together. a Metric tons.