
Page 100 - Energy from Toxic Organic Waste for Heat and Power Generation
P. 100
Paper Industry Wastes and Energy Generation From Wastes 85
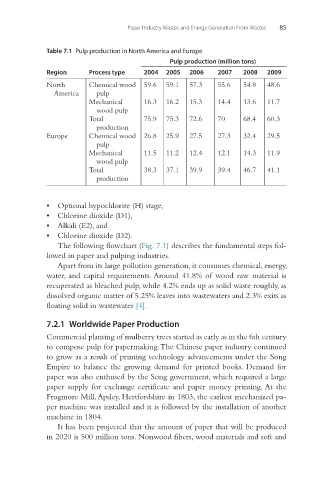
Table 7.1 Pulp production in North America and Europe
Pulp production (million tons)
Region Process type 2004 2005 2006 2007 2008 2009
North Chemical wood 59.6 59.1 57.3 55.6 54.8 48.6
America pulp
Mechanical 16.3 16.2 15.3 14.4 13.6 11.7
wood pulp
Total 75.9 75.3 72.6 70 68.4 60.3
production
Europe Chemical wood 26.8 25.9 27.5 27.3 32.4 29.5
pulp
Mechanical 11.5 11.2 12.4 12.1 14.3 11.9
wood pulp
Total 38.3 37.1 39.9 39.4 46.7 41.1
production
• Optional hypochlorite (H) stage,
• Chlorine dioxide (D1),
• Alkali (E2), and
• Chlorine dioxide (D2).
The following flowchart (Fig. 7.1) describes the fundamental steps fol-
lowed in paper and pulping industries.
Apart from its large pollution generation, it consumes chemical, energy,
water, and capital requirements. Around 41.8% of wood raw material is
recuperated as bleached pulp, while 4.2% ends up as solid waste roughly, as
dissolved organic matter of 5.25% leaves into wastewaters and 2.3% exits as
floating solid in wastewater [4].
7.2.1 Worldwide Paper Production
Commercial planting of mulberry trees started as early as in the 6th century
to compose pulp for papermaking. The Chinese paper industry continued
to grow as a result of printing technology advancements under the Song
Empire to balance the growing demand for printed books. Demand for
paper was also enthused by the Song government, which required a large
paper supply for exchange certificate and paper money printing. At the
Frogmore Mill, Apsley, Hertfordshire in 1803, the earliest mechanized pa-
per machine was installed and it is followed by the installation of another
machine in 1804.
It has been projected that the amount of paper that will be produced
in 2020 is 500 million tons. Nonwood fibers, wood materials and soft and