
Page 102 - Energy from Toxic Organic Waste for Heat and Power Generation
P. 102
Paper Industry Wastes and Energy Generation From Wastes 87
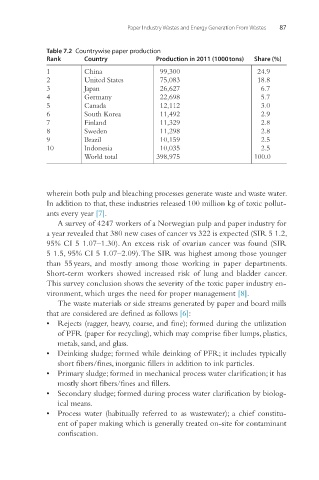
Table 7.2 Countrywise paper production
Rank Country Production in 2011 (1000 tons) Share (%)
1 China 99,300 24.9
2 United States 75,083 18.8
3 Japan 26,627 6.7
4 Germany 22,698 5.7
5 Canada 12,112 3.0
6 South Korea 11,492 2.9
7 Finland 11,329 2.8
8 Sweden 11,298 2.8
9 Brazil 10,159 2.5
10 Indonesia 10,035 2.5
World total 398,975 100.0
wherein both pulp and bleaching processes generate waste and waste water.
In addition to that, these industries released 100 million kg of toxic pollut-
ants every year [7].
A survey of 4247 workers of a Norwegian pulp and paper industry for
a year revealed that 380 new cases of cancer vs 322 is expected (SIR 5 1.2,
95% CI 5 1.07–1.30). An excess risk of ovarian cancer was found (SIR
5 1.5, 95% CI 5 1.07–2.09). The SIR was highest among those younger
than 55 years, and mostly among those working in paper departments.
Short-term workers showed increased risk of lung and bladder cancer.
This survey conclusion shows the severity of the toxic paper industry en-
vironment, which urges the need for proper management [8].
The waste materials or side streams generated by paper and board mills
that are considered are defined as follows [6]:
• Rejects (ragger, heavy, coarse, and fine); formed during the utilization
of PFR (paper for recycling), which may comprise fiber lumps, plastics,
metals, sand, and glass.
• Deinking sludge; formed while deinking of PFR; it includes typically
short fibers/fines, inorganic fillers in addition to ink particles.
• Primary sludge; formed in mechanical process water clarification; it has
mostly short fibers/fines and fillers.
• Secondary sludge; formed during process water clarification by biolog-
ical means.
• Process water (habitually referred to as wastewater); a chief constitu-
ent of paper making which is generally treated on-site for contaminant
confiscation.