
Page 265 - Engineered Interfaces in Fiber Reinforced Composites
P. 265
246 Engineered interfaces in fiber reinforced composites
0: -
IO
0 2 I 6 8 lO"60 80 1
Tr (MPa)
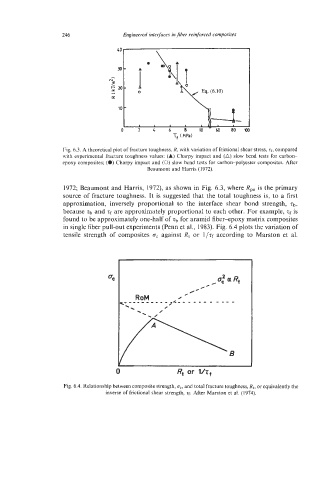
Fig. 6.3. A theoretical plot of fracture toughness, R, with variation of frictional shear stress, q, compared
with experimental fracture toughness values: (A) Charpy impact and (A) slow bend tests for carbon-
epoxy composites; (0) Charpy impact and (0) slow bend tests for carbon-polyester composites. After
Beaumont and Harris (1972).
1972; Beaumont and Harris, 1972), as shown in Fig. 6.3, where R,, is the primary
source of fracture toughness. It is suggested that the total toughness is, to a first
approximation, inversely proportional to the interface shear bond strength, Zh,
because q, and zf are approximately proportional to each other. For example, q is
found to be approximately one-half of Tb for aramid fiber-epoxy matrix composites
in single fiber pull-out experiments (Penn et al., 1983). Fig. 6.4 plots the variation of
tensile strength of composites bC against Rt or l/q according to Marston et al.
0 Rt or l/t,
Fig. 6.4. Relationship between composite strength, a,, and total fracture toughness, R,, or equivalently the
inverse of frictional shear strength, q. After Marston et al. (1974).