
Page 462 - Engineering Electromagnetics, 8th Edition
P. 462
444 ENGINEERING ELECTROMAGNETICS
(a)
(b)
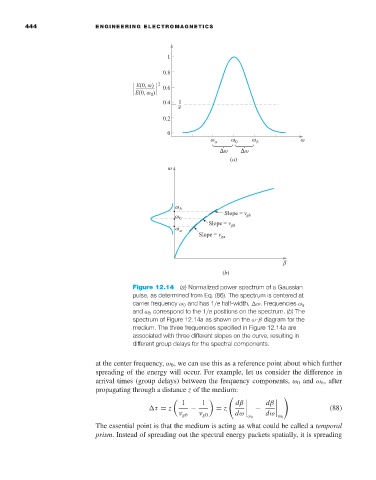
Figure 12.14 (a) Normalized power spectrum of a Gaussian
pulse, as determined from Eq. (86). The spectrum is centered at
carrier frequency ω 0 and has 1/e half-width, ω.Frequencies ω a
and ω b correspond to the 1/e positions on the spectrum. (b) The
spectrum of Figure 12.14a as shown on the ω-β diagram for the
medium. The three frequencies specified in Figure 12.14a are
associated with three different slopes on the curve, resulting in
different group delays for the spectral components.
at the center frequency, ω 0 ,we can use this as a reference point about which further
spreading of the energy will occur. For example, let us consider the difference in
arrival times (group delays) between the frequency components, ω 0 and ω b , after
propagating through a distance z of the medium:
1 1
τ = z − = z dβ − dβ (88)
ν gb ν g0 dω dω
ω b ω 0
The essential point is that the medium is acting as what could be called a temporal
prism. Instead of spreading out the spectral energy packets spatially, it is spreading