
Page 458 - Engineering Electromagnetics, 8th Edition
P. 458
440 ENGINEERING ELECTROMAGNETICS
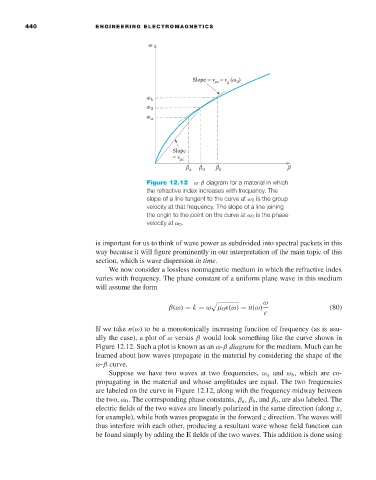
Figure 12.12 ω-β diagram for a material in which
the refractive index increases with frequency. The
slope of a line tangent to the curve at ω 0 is the group
velocity at that frequency. The slope of a line joining
the origin to the point on the curve at ω 0 is the phase
velocity at ω 0 .
is important for us to think of wave power as subdivided into spectral packets in this
way because it will figure prominently in our interpretation of the main topic of this
section, which is wave dispersion in time.
We now consider a lossless nonmagnetic medium in which the refractive index
varies with frequency. The phase constant of a uniform plane wave in this medium
will assume the form
ω
β(ω) = k = ω µ 0 (ω) = n(ω) (80)
c
If we take n(ω)tobea monotonically increasing function of frequency (as is usu-
ally the case), a plot of ω versus β would look something like the curve shown in
Figure 12.12. Such a plot is known as an ω-β diagram for the medium. Much can be
learned about how waves propagate in the material by considering the shape of the
ω-β curve.
Suppose we have two waves at two frequencies, ω a and ω b , which are co-
propagating in the material and whose amplitudes are equal. The two frequencies
are labeled on the curve in Figure 12.12, along with the frequency midway between
the two, ω 0 . The corresponding phase constants, β a , β b , and β 0 , are also labeled. The
electric fields of the two waves are linearly polarized in the same direction (along x,
for example), while both waves propagate in the forward z direction. The waves will
thus interfere with each other, producing a resultant wave whose field function can
be found simply by adding the E fields of the two waves. This addition is done using