
Page 457 - Engineering Electromagnetics, 8th Edition
P. 457
CHAPTER 12 Plane Wave Reflection and Dispersion 439
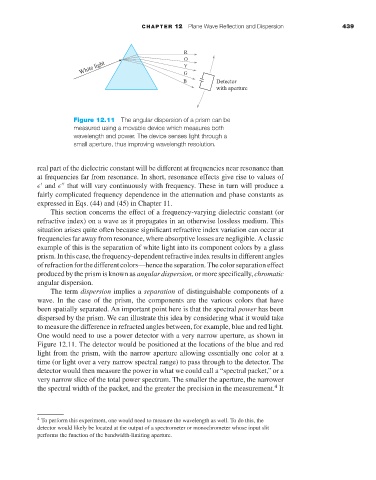
Figure 12.11 The angular dispersion of a prism can be
measured using a movable device which measures both
wavelength and power. The device senses light through a
small aperture, thus improving wavelength resolution.
real part of the dielectric constant will be different at frequencies near resonance than
at frequencies far from resonance. In short, resonance effects give rise to values of
and that will vary continuously with frequency. These in turn will produce a
fairly complicated frequency dependence in the attenuation and phase constants as
expressed in Eqs. (44) and (45) in Chapter 11.
This section concerns the effect of a frequency-varying dielectric constant (or
refractive index) on a wave as it propagates in an otherwise lossless medium. This
situation arises quite often because significant refractive index variation can occur at
frequencies far away from resonance, where absorptive losses are negligible. A classic
example of this is the separation of white light into its component colors by a glass
prism. In this case, the frequency-dependent refractive index results in different angles
of refraction for the different colors—hence the separation. The color separation effect
produced by the prism is known as angular dispersion, or more specifically, chromatic
angular dispersion.
The term dispersion implies a separation of distinguishable components of a
wave.In the case of the prism, the components are the various colors that have
been spatially separated. An important point here is that the spectral power has been
dispersed by the prism. We can illustrate this idea by considering what it would take
to measure the difference in refracted angles between, for example, blue and red light.
One would need to use a power detector with a very narrow aperture, as shown in
Figure 12.11. The detector would be positioned at the locations of the blue and red
light from the prism, with the narrow aperture allowing essentially one color at a
time (or light over a very narrow spectral range) to pass through to the detector. The
detector would then measure the power in what we could call a “spectral packet,” or a
very narrow slice of the total power spectrum. The smaller the aperture, the narrower
4
the spectral width of the packet, and the greater the precision in the measurement. It
4 To perform this experiment, one would need to measure the wavelength as well. To do this, the
detector would likely be located at the output of a spectrometer or monochrometer whose input slit
performs the function of the bandwidth-limiting aperture.