
Page 535 - Engineering Electromagnetics, 8th Edition
P. 535
CHAPTER 14 ELECTROMAGNETIC RADIATION AND ANTENNAS 517
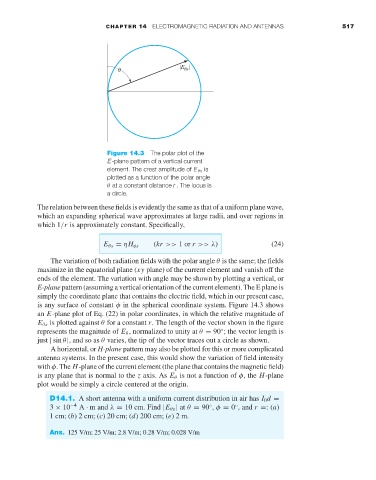
Figure 14.3 The polar plot of the
E-plane pattern of a vertical current
element. The crest amplitude of E θs is
plotted as a function of the polar angle
θ at a constant distance r . The locus is
a circle.
The relation between these fields is evidently the same as that of a uniform plane wave,
which an expanding spherical wave approximates at large radii, and over regions in
which 1/r is approximately constant. Specifically,
(kr >> 1or r >> λ) (24)
E θs = ηH φs
The variation of both radiation fields with the polar angle θ is the same; the fields
maximize in the equatorial plane (xy plane) of the current element and vanish off the
ends of the element. The variation with angle may be shown by plotting a vertical, or
E-plane pattern (assuming a vertical orientation of the current element). The E plane is
simply the coordinate plane that contains the electric field, which in our present case,
is any surface of constant φ in the spherical coordinate system. Figure 14.3 shows
an E-plane plot of Eq. (22) in polar coordinates, in which the relative magnitude of
E θs is plotted against θ for a constant r. The length of the vector shown in the figure
represents the magnitude of E θ , normalized to unity at θ = 90 ; the vector length is
◦
just | sin θ|, and so as θ varies, the tip of the vector traces out a circle as shown.
A horizontal, or H-plane pattern may also be plotted for this or more complicated
antenna systems. In the present case, this would show the variation of field intensity
with φ. The H-plane of the current element (the plane that contains the magnetic field)
is any plane that is normal to the z axis. As E θ is not a function of φ, the H-plane
plot would be simply a circle centered at the origin.
D14.1. A short antenna with a uniform current distribution in air has I 0 d =
3 × 10 −4 A · m and λ = 10 cm. Find |E θs | at θ = 90 , φ = 0 , and r =:(a)
◦
◦
1 cm; (b)2 cm; (c)20 cm; (d) 200 cm; (e)2m.
Ans. 125 V/m; 25 V/m; 2.8 V/m; 0.28 V/m; 0.028 V/m