
Page 202 - Enhanced Oil Recovery in Shale and Tight Reservoirs
P. 202
Fluid-rock interactions 185
pressure could be set different from the confining pressure. For the CT
images, darker color represents pores and fractures.
Three Eagle Ford core samples were used to conduct oil imbibition tests
for 48 h first; after drying, water imbibition tests were conducted for 48 h.
The test conditions and masses after imbibition are listed in Table 8.1.
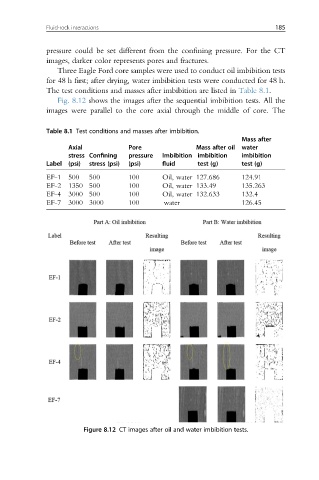
Fig. 8.12 shows the images after the sequential imbibition tests. All the
images were parallel to the core axial through the middle of core. The
Table 8.1 Test conditions and masses after imbibition.
Mass after
Axial Pore Mass after oil water
stress Confining pressure Imbibition imbibition imbibition
Label (psi) stress (psi) (psi) fluid test (g) test (g)
EF-1 500 500 100 Oil, water 127.686 124.91
EF-2 1350 500 100 Oil, water 133.49 135.263
EF-4 3000 500 100 Oil, water 132.633 132.4
EF-7 3000 3000 100 water 126.45
Figure 8.12 CT images after oil and water imbibition tests.