
Page 197 - Enhanced Oil Recovery in Shale and Tight Reservoirs
P. 197
180 Enhanced Oil Recovery in Shale and Tight Reservoirs
Similarly, Chenevert (1969) found that the swelling pressure induced by
water adsorption on clay minerals could be extremely high. This was the
case of crystalline swelling for the first layers of water adsorbed on the
surface. Equations to estimate the potential swelling pressure of shale were
suggested as a function of the activity of the water in the shale. The adsorp-
tion of water by clay platelets induces large internal stresses in confined sam-
ples or expands the unconfined samples (Chenevert, 1970). Adsorption of
water on the surface of negatively charged clay platelets develops internal
expansive stresses, and in turn expands and disintegrates the unconfined shale
samples (Hensen and Smit, 2002; Steiger, 1982).
When Sun et al. (2015) did imbibition tests, core surfaces were sealed
with epoxy except the two end surfaces were open. They observed micro-
fractures generated during imbibition. The epoxy prevented the cores from
falling apart owing to fracturing.
Zhang and Sheng (2018) studied the effect of water imbibition on fracture
generation in Mancos shale cores under isotropic stress conditions using an
isotropically confined core holder. Slices along the axial direction of the shale
core were obtained by CT scanning. An NL3000 CereTom X-ray CT scan-
ner made by NeuroLogica Company was used to conduct the CT tests. The
3
CT scanner’s minimum recognizable slice volume was 0.1225 mm (with a
slice thickness of 1 mm) and spatial resolution was 0.35 0.35 mm. The
relative density resolution for the CT machine was 0.3% Hu. To improve
the contrast, an adaptive pseudocolor enhancement method (Li et al.,
2011) based upon gray scale-color transformation and Otsu thresholding seg-
mentation (Otsu, 1979) was adopted to create color images.
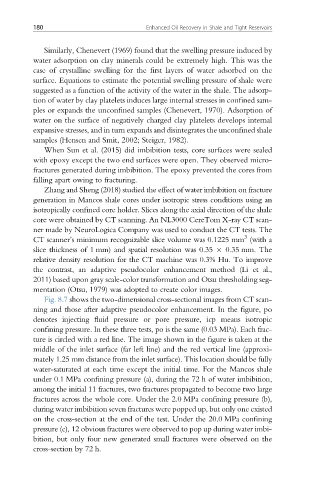
Fig. 8.7 shows the two-dimensional cross-sectional images from CT scan-
ning and those after adaptive pseudocolor enhancement. In the figure, po
denotes injecting fluid pressure or pore pressure, icp means isotropic
confining pressure. In these three tests, po is the same (0.03 MPa). Each frac-
ture is circled with a red line. The image shown in the figure is taken at the
middle of the inlet surface (far left line) and the red vertical line (approxi-
mately 1.25 mm distance from the inlet surface). This location should be fully
water-saturated at each time except the initial time. For the Mancos shale
under 0.1 MPa confining pressure (a), during the 72 h of water imbibition,
among the initial 11 fractures, two fractures propagated to become two large
fractures across the whole core. Under the 2.0 MPa confining pressure (b),
during water imbibition seven fractures were popped up, but only one existed
on the cross-section at the end of the test. Under the 20.0 MPa confining
pressure (c), 12 obvious fractures were observed to pop up during water imbi-
bition, but only four new generated small fractures were observed on the
cross-section by 72 h.