
Page 194 - Enhanced Oil Recovery in Shale and Tight Reservoirs
P. 194
Fluid-rock interactions 177
Xue et al. (2018) found that the organic matter and organic pores in shale
samples were unchanged after hydration, but the fractures were likely to
form between organic matter and inorganic minerals, and microfractures
could probably be generated or induced in inorganic minerals. The cohesive
force between mineral particles became weak after hydration. The nonclay
mineral particles fell off to form inorganic pores, and these pores gradually
developed into microfractures between nonclay and clay mineral particles.
In their experiments, shale samples were not confined during hydration.
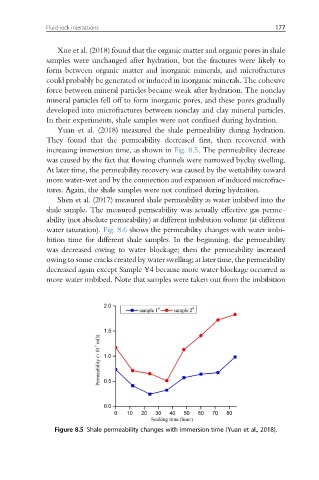
Yuan et al. (2018) measured the shale permeability during hydration.
They found that the permeability decreased first, then recovered with
increasing immersion time, as shown in Fig. 8.5. The permeability decrease
was caused by the fact that flowing channels were narrowed byclay swelling.
At later time, the permeability recovery was caused by the wettability toward
more water-wet and by the connection and expansion of induced microfrac-
tures. Again, the shale samples were not confined during hydration.
Shen et al. (2017) measured shale permeability as water imbibed into the
shale sample. The measured permeability was actually effective gas perme-
ability (not absolute permeability) at different imbibition volume (at different
water saturation). Fig. 8.6 shows the permeability changes with water imbi-
bition time for different shale samples. In the beginning, the permeability
was decreased owing to water blockage; then the permeability increased
owing to some cracks created by water swelling; at later time, the permeability
decreased again except Sample Y4 because more water blockage occurred as
more water imbibed. Note that samples were taken out from the imbibition
Figure 8.5 Shale permeability changes with immersion time (Yuan et al., 2018).