
Page 21 - Enhanced Oil Recovery in Shale and Tight Reservoirs
P. 21
Huff-n-puff gas injection in oil reservoirs 11
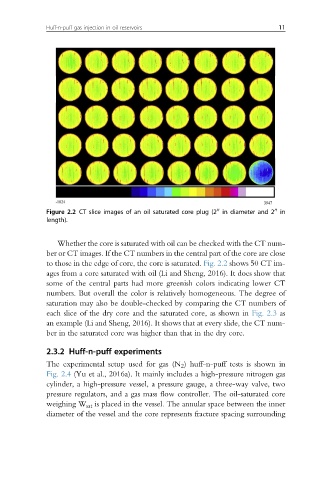
Figure 2.2 CT slice images of an oil saturated core plug (2 in diameter and 2 in
00
00
length).
Whether the core is saturated with oil can be checked with the CT num-
ber or CT images. If the CT numbers in the central part of the core are close
to those in the edge of core, the core is saturated. Fig. 2.2 shows 50 CT im-
ages from a core saturated with oil (Li and Sheng, 2016). It does show that
some of the central parts had more greenish colors indicating lower CT
numbers. But overall the color is relatively homogeneous. The degree of
saturation may also be double-checked by comparing the CT numbers of
each slice of the dry core and the saturated core, as shown in Fig. 2.3 as
an example (Li and Sheng, 2016). It shows that at every slide, the CT num-
ber in the saturated core was higher than that in the dry core.
2.3.2 Huff-n-puff experiments
The experimental setup used for gas (N 2 ) huff-n-puff tests is shown in
Fig. 2.4 (Yu et al., 2016a). It mainly includes a high-pressure nitrogen gas
cylinder, a high-pressure vessel, a pressure gauge, a three-way valve, two
pressure regulators, and a gas mass flow controller. The oil-saturated core
weighing W sat is placed in the vessel. The annular space between the inner
diameter of the vessel and the core represents fracture spacing surrounding