
Page 25 - Enhanced Oil Recovery in Shale and Tight Reservoirs
P. 25
Huff-n-puff gas injection in oil reservoirs 15
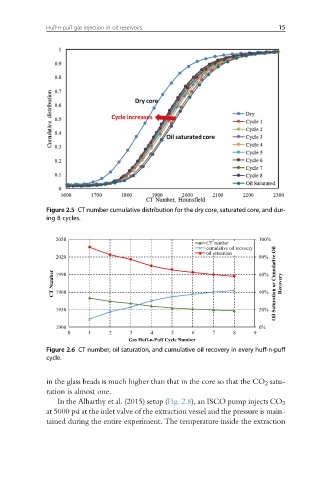
Figure 2.5 CT number cumulative distribution for the dry core, saturated core, and dur-
ing 8 cycles.
2050 100%
CT number
cumulative oil recvoery
oil saturation
2020 80%
CT Number 1990 60% Oil Saturation or Cumulative Oil Recovery
40%
1960
1930 20%
1900 0%
0 1 2 3 4 5 6 7 8 9
Gas Huff-n-Puff Cycle Number
Figure 2.6 CT number, oil saturation, and cumulative oil recovery in every huff-n-puff
cycle.
in the glass beads is much higher than that in the core so that the CO 2 satu-
ration is almost one.
In the Alharthy et al. (2015) setup (Fig. 2.8), an ISCO pump injects CO 2
at 5000 psi at the inlet valve of the extraction vessel and the pressure is main-
tained during the entire experiment. The temperature inside the extraction