
Page 244 - Enhanced Oil Recovery in Shale and Tight Reservoirs
P. 244
EOR mechanisms of wettability alteration and its comparison with IFT 227
may have both functions, and it is difficult to split these two functions by
experiments. Sheng (2013b) used the simulator, UTCHEM version 9.95
(UT Austin, 2009), to study these two mechanisms.
HirasakiandZhang(2004)conductedspontaneousimbibitionexperiments
using the formation brine, stock-tank crude oil, and core samples of the dolo-
mite formation from the Yates field. A core was saturated with the oil and
connate water first, and then immersed in an imbibition cell. The imbibition
cell was filled with either the formation brine or an alkaline surfactant solution.
The formation brine had 5815 mg/L NaCl, 2942 mg/L CaCl 2 $H 2 O,
2032 mg/L MgCl 2 $H 2 O, 237 Na 2 SO 4 ,and 7Fe(NH 4 ) 2 (SO 4 ) 2 $6H 2 O.
The alkali used was 0.3 M Na 2 CO 3 . The surfactants were 0.025% CS-
330 (C 12 -3EO-sulfate) and 0.025% TDA-4PO (C 13 e4PO-sulfate). The
cores were aged 24 h at 80 C. The spontaneous imbibition tests in the for-
mation brine did not drive oil out of the cores, confirming the cores were oil-
wet. The imbibition test in the alkaline surfactant solution lasted 138 days, and
44% oil was driven out.
Delshad et al. (2009) used a 3D simulation model to have successfully his-
tory matched the Hirasaki and Zhang (2004) experiments. Sheng (2013b)
used their model as the base model for the study. The simulation model is
a homogenous Cartesian grid with 7 7 7 grid blocks. 5 5 5grid
blocks in the middle of the model represent the core, and the remaining
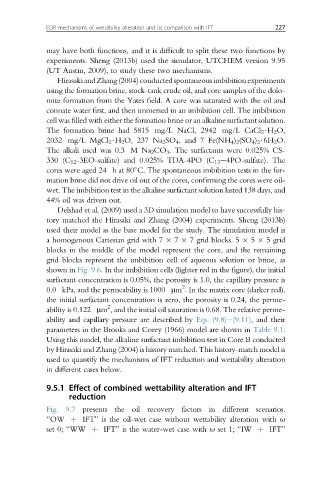
grid blocks represent the imbibition cell of aqueous solution or brine, as
shown in Fig. 9.6. In the imbibition cells (lighter red in the figure), the initial
surfactant concentration is 0.05%, the porosity is 1.0, the capillary pressure is
2
0.0 kPa, and the permeability is 1000 mm . In the matrix core (darker red),
the initial surfactant concentration is zero, the porosity is 0.24, the perme-
2
ability is 0.122 mm , and the initial oil saturation is 0.68. The relative perme-
ability and capillary pressure are described by Eqs. (9.8)e(9.11), and their
parameters in the Brooks and Corey (1966) model are shown in Table 9.1.
Using this model, the alkaline surfactant imbibition test in Core B conducted
by Hirasaki and Zhang (2004) is history matched. This history-match model is
used to quantify the mechanisms of IFT reduction and wettability alteration
in different cases below.
9.5.1 Effect of combined wettability alteration and IFT
reduction
Fig. 9.7 presents the oil recovery factors in different scenarios.
“OW þ IFT” is the oil-wet case without wettability alteration with u
set 0; “WW þ IFT” is the water-wet case with u set 1; “IW þ IFT”