Page 283 - Enhanced Oil Recovery in Shale and Tight Reservoirs
P. 283

260                            Enhanced Oil Recovery in Shale and Tight Reservoirs


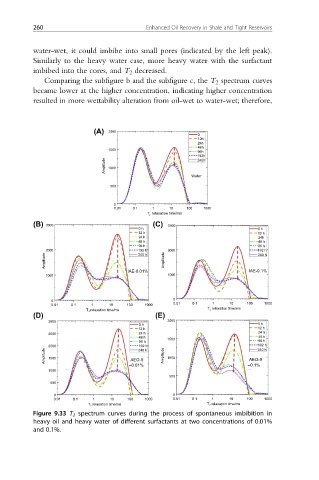
          water-wet, it could imbibe into small pores (indicated by the left peak).
          Similarly to the heavy water case, more heavy water with the surfactant
          imbibed into the cores, and T 2 decreased.
             Comparing the subfigure b and the subfigure c, the T 2 spectrum curves
          became lower at the higher concentration, indicating higher concentration
          resulted in more wettability alteration from oil-wet to water-wet; therefore,


                          (A)  2000                   0
                                                      12h
                                                      24h
                                                      48h
                              1500                    96h
                                                      192h
                             Amplitude  1000
                                                      240h
                                                     Water
                               500

                                0
                                0.01  0.1  1   10  100  1000
                                         T  relaxation time/ms
          (B)  3000                       (C)  3000
                                      0 h                              0 h
                                      12 h                             12 h
                                      24 h                             24h
                                      48 h                             48 h
                                      96 h                             96 h
             2000                     192 h   3000                     192 h
                                      240 h
                                                                       240 h
             Amplitude                       Amplitude
                                   IAE-0.01%                        IAE-0.1%
             1000                             1000
               0                                0
               0.01  0.1  1   10   100  1000    0.01  0.1  1   10   100  1000
                        T  relaxation time/ms            T  relaxation time/ms
          (D)                              (E)
              3000                            2000
                                       0 h                             0 h
                                      12 h                             12 h
              2500                    24 h                             24 h
                                       48 h   1500                     48 h
                                       96 h                            96 h
              2000                    192 h                            192 h
                                                                       240 h
             Amplitude  1500        AEO-9    Amplitude  1000        AEO-9
                                      240 h
                                    –0.01%                          –0.1%
              1000
                                               500
               500
                0                               0
                0.01  0.1  1   10  100  1000    0.01  0.1  1   10   100  1000
                         T  relaxation time/ms           T  relaxation time/ms
          Figure 9.33 T 2 spectrum curves during the process of spontaneous imbibition in
          heavy oil and heavy water of different surfactants at two concentrations of 0.01%
          and 0.1%.
   278   279   280   281   282   283   284   285   286   287   288